Are your customers receiving the right service? Do your customer service reps have the knowledge and skills to solve customers’ queries?
Are you providing better support than your competitors? Are you leveraging the latest technology to serve your customers better?
These are crucial questions; you need to find their answers to analyze your call center’s performance.
This is where call center metrics and KPIs can help you.
These contact center metrics help you measure your achievements, determine areas of improvement, and drive accountability.
Also, they can help you identify top performers and determine their strengths and weaknesses so you can provide sales coaching and training for each agent.
With these valuable insights, you can better understand your customers, provide them with tailored solutions, and ultimately boost your company’s sales and revenue.
Are some call center metrics more important than others?
And what should you do with all those metrics and KPIs? Here’s everything you need to know.
Related: Call Center Quality Assurance Metrics: 13 Essential KPIs
A. What are call center metrics?
Call center metrics (KPIs) are quantitative measurements that you can use to track and evaluate the performance of your call center or customer support.
These metrics help you answer a few questions:
- How seamless is your customer support process, from start to finish?
- How quickly and efficiently are your agents resolving customers’ issues?
- How satisfied are your customers with the service?
- Where do you need to improve?
By analyzing call center metrics and call center statistics, your managers can identify areas for improvement, set goals, monitor progress, and make data-driven decisions.
Using advanced call monitoring software that understands both qualitative and quantitative data, you can track and measure call center metrics or KPIs.
By the way, Enthu.AI is a conversational intelligence platform that helps you track almost all important call center KPIs.
It comes with speech analytics, call monitoring, call transcription, and quality management that provides insights into the performance of individual agents by analyzing conversations between agents and customers.

B. 19 essential call center metrics
1. First contact resolution (FCR)
First contact resolution (FCR) is an essential part of customer relationships with any company.
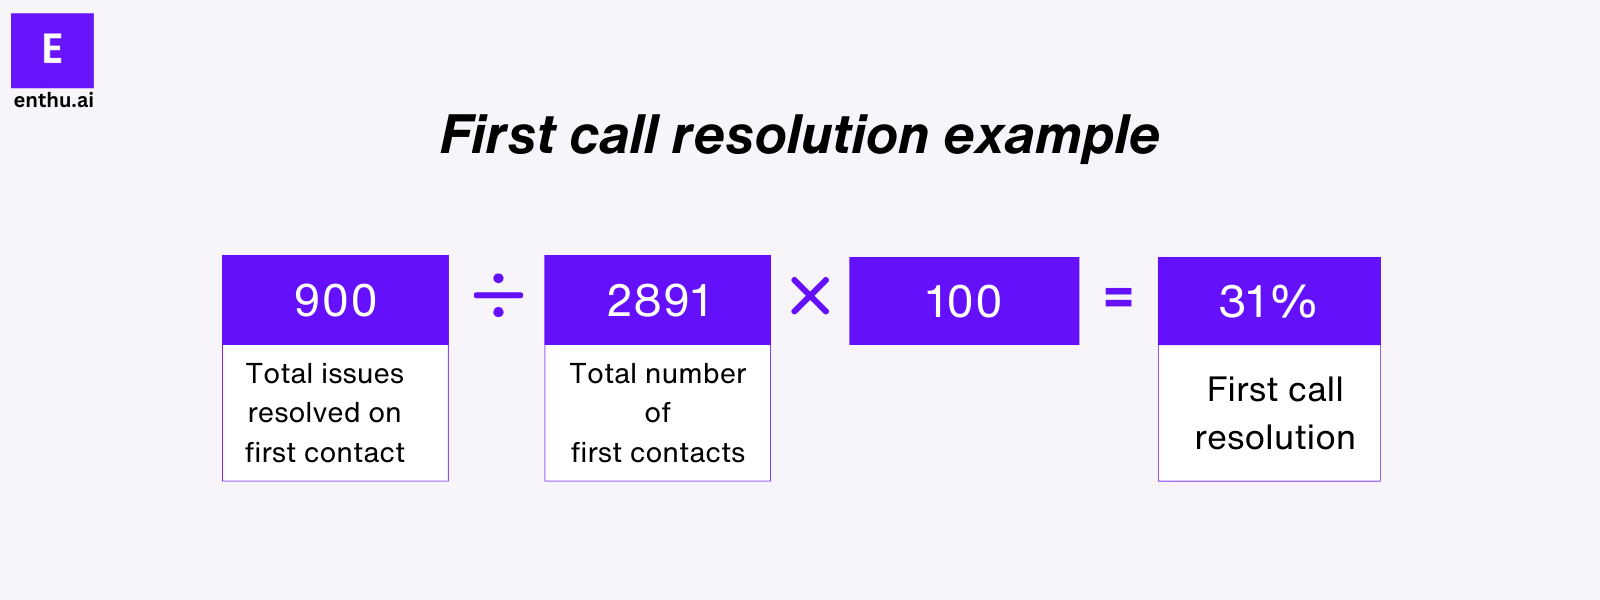
It measures how often your agents solve customer issues on the first interaction. It’s about getting it right the first time without callbacks or transfers.
High FCR means happier customers and smoother operations.
| Formula | Benchmark | Why It Matters |
|---|---|---|
| (Resolved on First Contact ÷ Total Cases) × 100 | 70–80% | Higher FCR = fewer repeat calls, happier customers, and lower costs. |
By tracking FCR, you can gauge overall performance, identify areas for improvement, and ensure seamless experiences, boosting customer satisfaction and loyalty.
Aim for FCR rates above industry benchmarks for optimal results.
2. Customer satisfaction(CSAT)
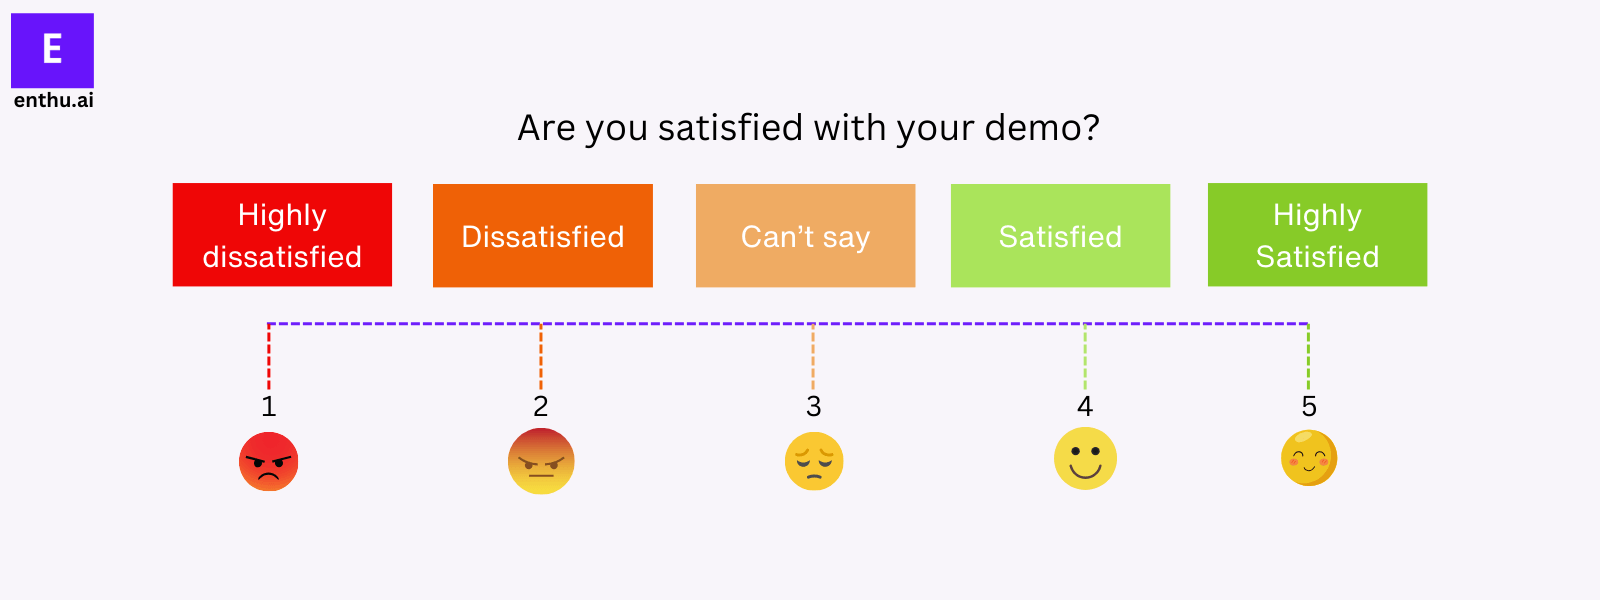
Customer Satisfaction (CSAT) measures how happy customers are with your service.
95% of contact center professionals view customer satisfaction as the most important call center metric.
You ask them to rate their experience, and based on their answers, they’re categorized as:
- Very satisfied
- Satisfied
- Neutral
- Unsatisfied
- Very unsatisfied
CSAT is calculated by dividing the number of satisfied customers by the total number of responses.
Formula of Customer satisfaction (CSAT)
Number of Satisfied Customers / Total Number of Survey Respondents
It’s important to track CSAT over time to see how you’re doing. The higher the score, the better! Keep making customers happy to build a strong reputation.
3. Customer effort score (CES)
The Customer Effort Score (CES) is on the most important contact center metric measures how much effort customers put in to resolve their issues. You ask them one question to measure their experience using a simple scale.
Higher CES indicates smoother support, while lower scores suggest frustration.
Tracking CES trends helps identify areas for improvement. The goal is to minimize customer effort by providing efficient solutions and well-trained agents.
Formula of CES (Customer effort score)
% of Customers Who Agree – % of Customers Who Disagree
Focus on high and increasing scores for seamless support experiences. Reduce customer effort with well-trained agents and efficient solutions.
By reducing customer effort, you enhance satisfaction and loyalty, ensuring customers feel supported and valued throughout their interactions with your call center.
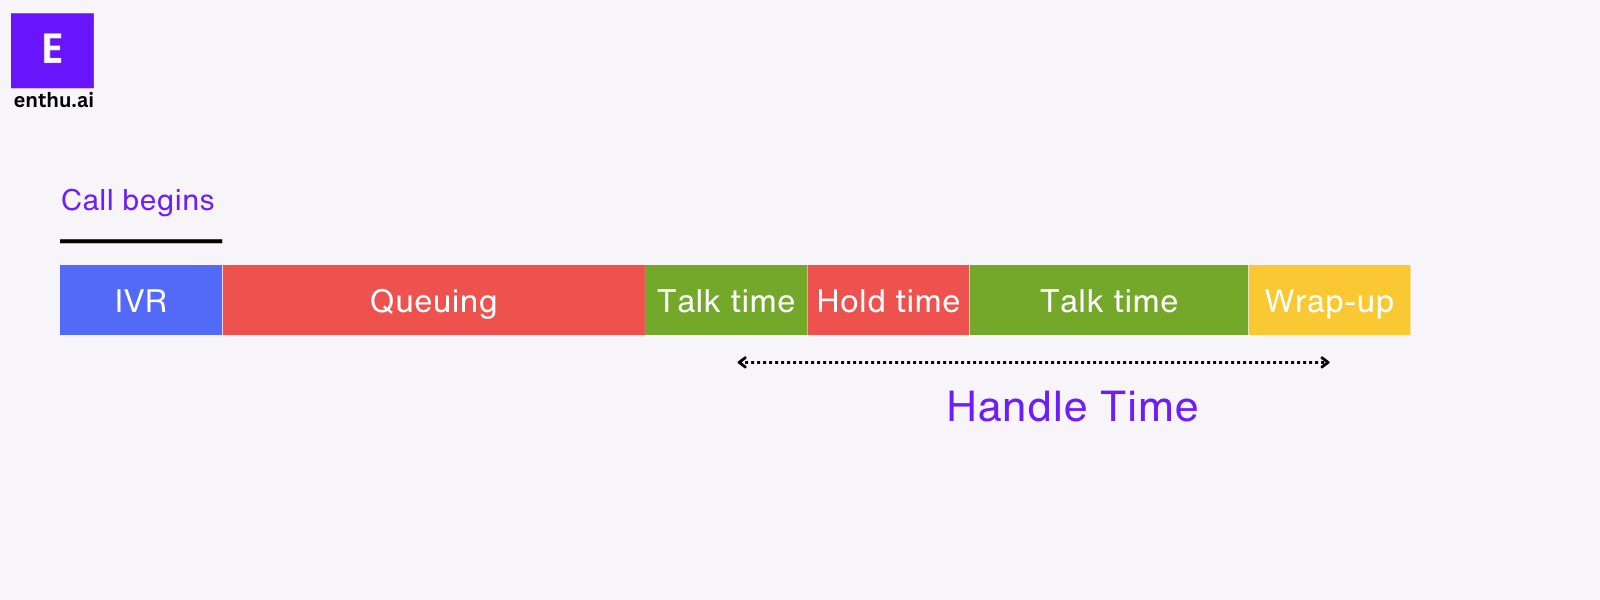
4. Average handle time (AHT)
Average Handle Time (AHT) measures how long agents spend handling customer calls, including hold and post-call tasks.
Tracking AHT helps set performance goals, identify training needs, and optimize staffing.
Formula: Average handle time (AHT)
(Total Talk Time + Total Hold Time + Total After-Call Work Time) / Total Number of Calls
While low AHT indicates efficiency, balancing speed with quality is crucial to ensure customers receive effective support.
Strive for continual improvement in AHT to enhance productivity and customer satisfaction in your call center.
5. Average call duration (ACD)
Average Call Duration (ACD) in your call center shows how long your team spends on calls with clients. It’s crucial for your sales and support teams, which usually have time limits per call.
Monitoring this metric motivates agents to support each other and decrease call times.
Average call duration (ACD) Formula
Total Talk Time/Total Number of Calls
By tracking this daily, you can also understand client behavior patterns and optimize resource usage for consistent performance throughout the week.
Use real-time data to visualize and improve average call duration. This will help you enhance overall efficiency and customer satisfaction in your call center.
6. Net promoter score (NPS)
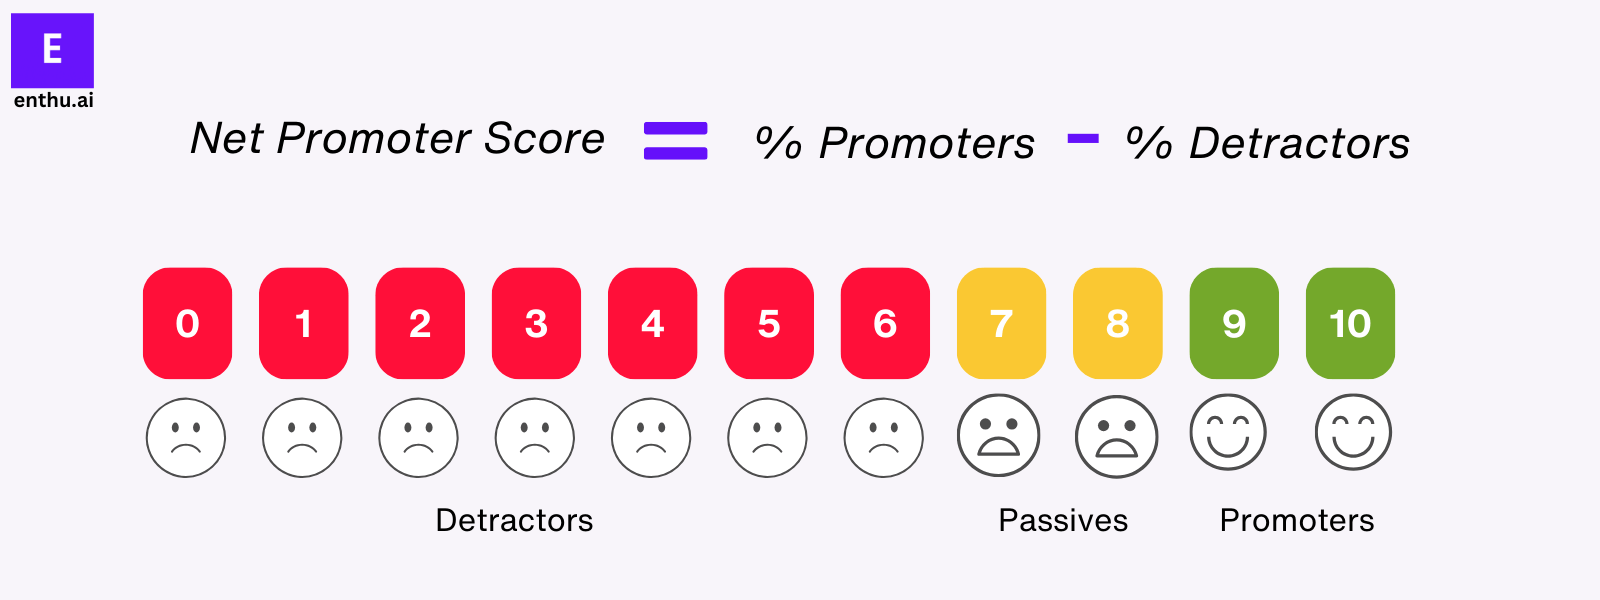
Net Promoter Score (NPS) measures how likely customers are to recommend your company.
You ask them one question: “On a scale of 0-10, how likely are you to recommend us?”
Based on their scores, they’re grouped into:
- Promoters – (score 9-10) – (enthusiastic supporters)
- Passives – (score 7-8) – (satisfied but not enthusiastic)
- and Detractors – (score 0-6) – (unhappy customers).
NPS (Net promoter score) Formula
% Promoters – % Detractors
A higher score means more loyal customers.
NPS helps you understand what customers love and areas needing improvement. Improving this metric improves customer satisfaction, customer loyalty, and brand reputation in your call center.
7. Customer churn rate (CCR)
Customer Churn Rate (CCR) tells you how many customers have stopped using your services within a specific time period. High CCR suggests unhappy customers, possibly due to unresolved issues or poor communication.
Your agents are crucial in reducing CCR by effectively handling customer complaints.
Monitoring CCR helps gauge customer satisfaction and identifies areas for improvement to retain more customers.
Formula: (CCR) Customer churn rate
(Number of customers lost during a period/total number of customers at the beginning of the period)*100
Addressing churn promptly is vital to maintaining a healthy customer base and reducing call center attrition.
8. Customer retention rate (CRR)
CRR signifies the percentage of customers loyal to your company over time.
Understanding CRR allows you to assess customer satisfaction and the effectiveness of your services.
Formula of CCR (Customer retention rate)
(Customers at the End of the Period) – (New Customers Acquired) / Customers at the Start of the Period.
A high CRR reflects satisfied customers, indicating that your services effectively meet their needs. Conversely, a low CRR may point to issues that require attention to prevent customer churn.
By regularly keeping an eye on CRR and taking appropriate actions, you can maintain long-term customer satisfaction and success in your call center operations
9. Average speed of answer (ASA)
It’s the average time callers wait before connecting with an agent. This metric reflects your responsiveness and service quality from the customer’s viewpoint.
Try to answer calls promptly to enhance customer satisfaction. Track ASA regularly, comparing it against set goals.
Formula: Average speed of answer (ASA)
Total wait time of all answered calls / Total number of answered calls.
A consistent and low ASA indicates efficient call handling and meets customer expectations.
Maintaining a swift ASA ensures customers feel valued and attended to promptly in your call center operations.
10. Percentage of calls blocked (PCB)
This metric shows the portion of incoming calls met with busy signals, highlighting potential issues in managing call volumes and customer satisfaction.
High percentages signal missed opportunities to connect with customers and provide assistance.
Formula of PCB
(Number of Abandoned Calls/ Total Number of Incoming Calls) x 100
By tracking this metric, you gain insight into customer frustration levels and identify areas for improvement in staffing or infrastructure.
Strive to keep this metric low to ensure customers can always reach you when they need support.
11. Service level
In your call center, Service Level measures how quickly agents answer inbound calls. Aim for a target of 80% of calls answered within 20 seconds.
This metric reflects efficiency in meeting customer demand. Tracking Service Levels helps you assess operational effectiveness and adjust resources as needed.
Formula of Service Level
(Calls Answered in X seconds or less / Total Inbound Calls) x 100
A High Service Level ensures minimal wait times, reduces call abandonment, and meets service standards.
To optimize, focus on skills-based routing, cross-training, and staffing during peak times.
12. Occupancy rate
The occupancy rate shows how much time agents spend helping customers compared to their total logged-in time.
Aim for a rate between 75-85%. Low rates below 70% may mean agents have too much idle time, affecting productivity and revenue.
Occupancy rate Formula
(Total Handling Time / Total Logged In Time) x 100
To improve, adjust schedules, reduce non-essential tasks, and coach agents on efficient contact handling.
Monitoring Occupancy Rate ensures efficient staffing and better customer service, leading to higher satisfaction levels.
13. Contact quality
Contact quality is an essential customer-centric performance metric across every contact center.
Contact quality metrics measure the quality of the interaction between customers and agents. Tracking this metric can help you understand customer needs and individual agent performance.
You need to have a defined call quality monitoring software to analyze and evaluate agent calls. As part of the process, you need to design a call quality evaluation form to measure contact quality.
14. Call transfer rate
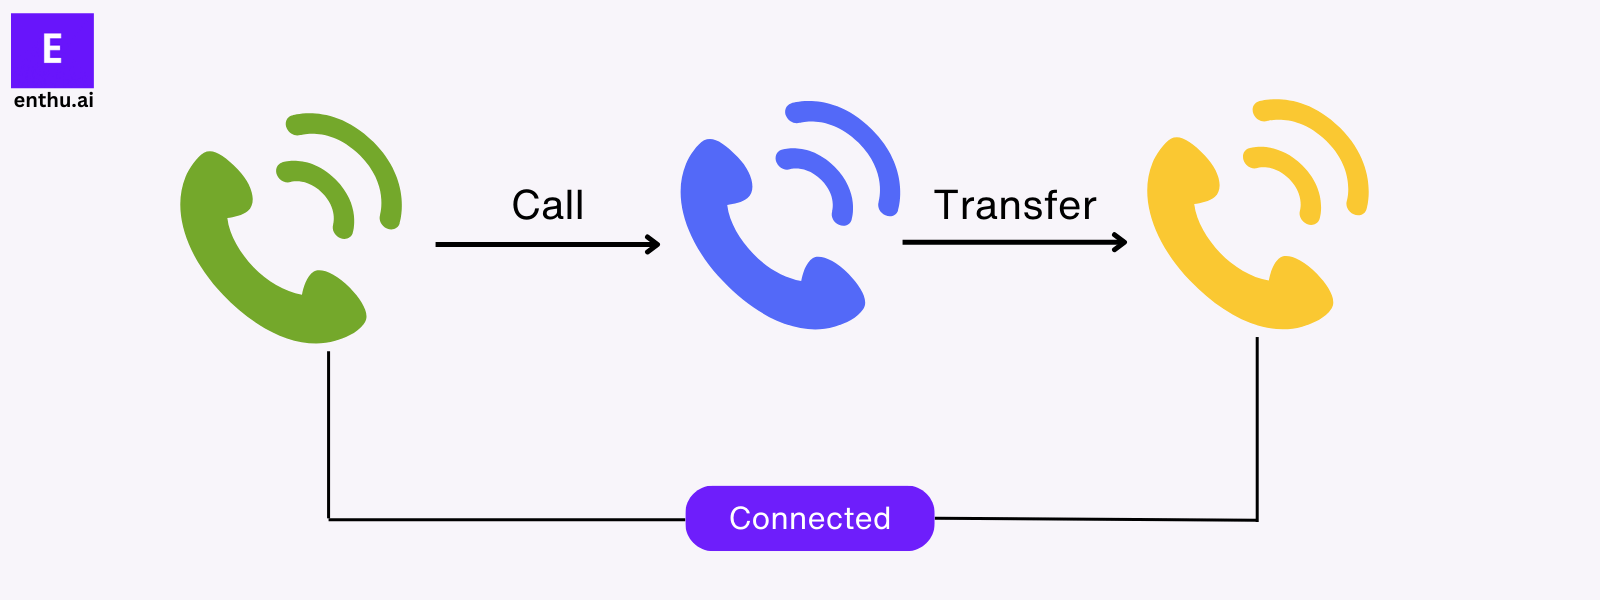
Call Transfer Rate is the percentage of inbound calls transferred to another agent one or more times.
Formula of Call Transfer Rate
(Total number of queries routed to more than one agent ÷ total number of connected inbound contacts) x 100
It’s crucial for achieving first-contact resolution and improving customer experience.
Use predictive routing, agent-assist tools for your call center, SME channels, quality management, and channel splitting to minimize transfers and enhance service quality.
15. Average Wait Time (AWT)
Average Wait Time (AWT) is the duration callers spend waiting in the queue before connecting with an agent.
Industry standards suggest that 80% of calls should be answered within 20 seconds.
Average Wait Time (AWT) Formula
Total time callers wait in the queue/total number of calls answered.
Meeting this benchmark enhances customer satisfaction by reducing call abandonment and ensuring prompt service.
Customers begin to show frustration at the 2-minute mark. Keeping AWT under 60 seconds is a competitive advantage.
16. Abandonment call rate (ACR)
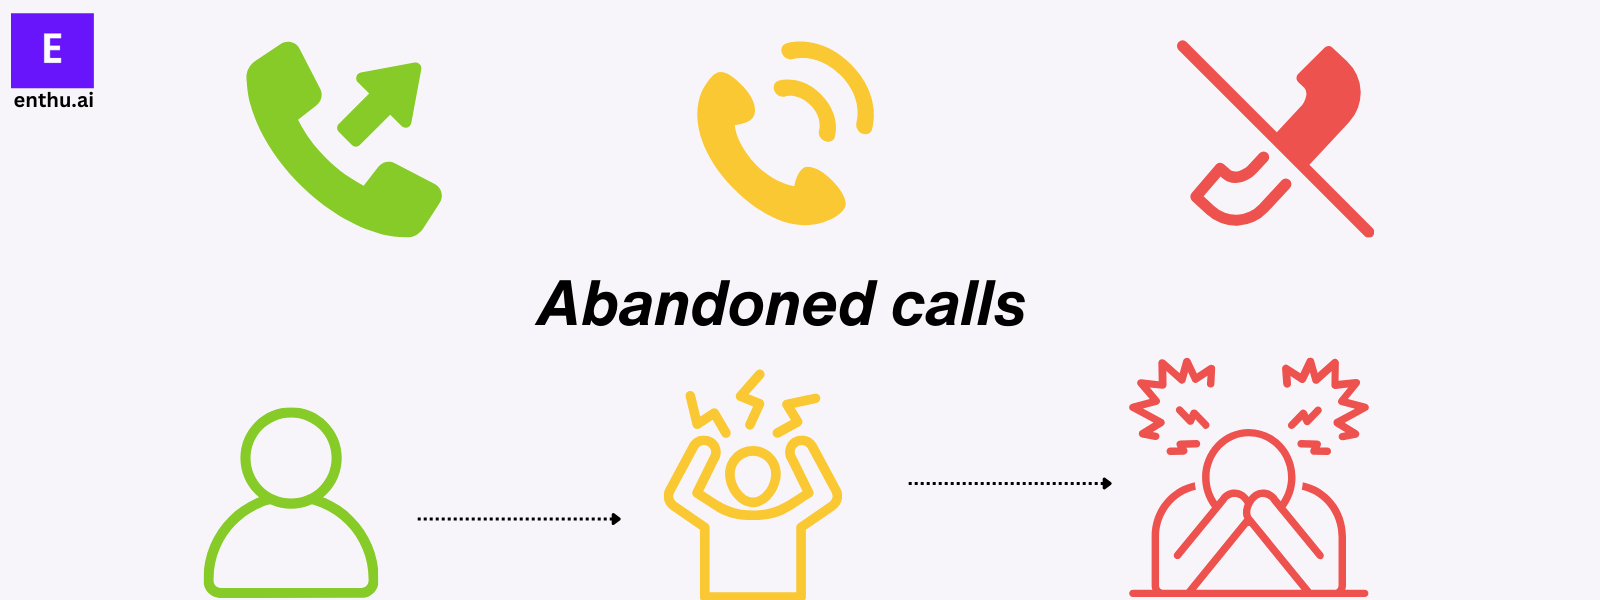
This KPI measures the percentage of inbound calls that customers hang up before connecting with an agent.
High abandonment rates often result from long hold times, poor IVR design, or inefficient call routing.
ACR (Abandonment call rate) formula
(No. calls Abandoned / Total no. calls) × 100
Monitoring and reducing this metric is crucial for improving customer satisfaction and optimizing call center performance.
17. Cost per call (CPC)
It measures the average cost incurred by your call center to handle each phone call, including staffing, technology, and facility expenses.
Tracking CPC helps control budgets, optimize resources, and ensure financial efficiency in delivering customer support.
Formula: (CPC) Cost per call
Total Cost of Call Center Operations / Total Calls Handled
Lower CPC indicates higher productivity and better cost management.
Example: Typical CPC ranges from $2.70 to $5.60, depending on industry. AI and automation can cut this by 10–20%.
18. Agent attrition rate

This KPI measures the percentage of agents leaving your call center within a specific period. High attrition can raise costs and disrupt service quality.
Formula of Agent Attrition Rate
(number of agents who left during a period/average number of agents during that period)*100
Monitoring this metric helps identify reasons for turnover and implement retention strategies.
19. Average after-call work time (ACWT)
It measures how long call center employees can complete post-call tasks after a customer hangs up.
Formula of Average after-call work time (ACWT)
Total time spent by agents over a set period/total number of calls over that period.
It helps evaluate your staff efficiency and identifies workflow bottlenecks. High ACWT may indicate inefficient procedures or time management.
Auto-fill call notes and CRM syncs can reduce ACWT by 30–40%, freeing up agents for more customer time.
How do you calculate Call Center ROI in 2026?
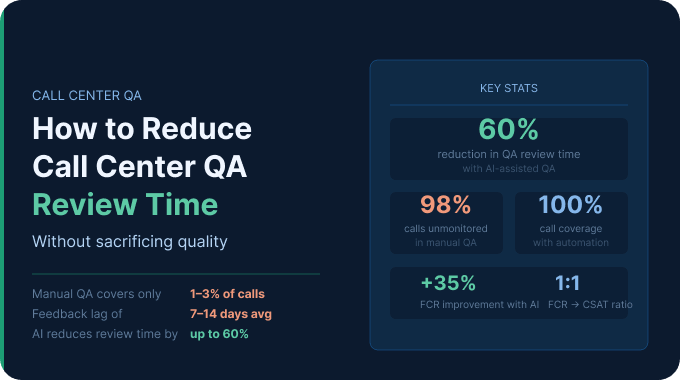
“Call Center ROI is calculated by measuring the reduction in Customer Churn Rate (CCR) against the total operational cost. For every 1% increase in First Contact Resolution (FCR), there is a correlated 1% to 5% increase in total revenue through customer retention.”
Conclusion
It’s always a best practice to measure important call center metrics.
Effective call center technology is crucial, particularly when equipped with analytics capabilities.
Enthu.AI’s call center solutions include an analytics add-on providing call transcription, monitoring, sales performance metrics, reporting, and other features.
This enables real-time data collection while your team focuses on delivering excellent customer support.
FAQs
1. What are the KPIs for call centers?
KPIs for call centers include metrics like Average Handling Time (AHT), First Call Resolution (FCR), and Customer Satisfaction (CSAT).
2. What are the metrics of a call center QA?
Call center QA metrics typically include call monitoring scores, adherence to scripts or guidelines, and resolution accuracy.
3. What is a KPI checklist?
A KPI checklist is a tool for defining and tracking Key Performance Indicators (KPIs) relevant to a specific business or department, ensuring alignment with organizational goals and objectives.


 On this page