Your contact center is buzzing with activity-calls, chats, follow-ups, and escalations. But without clear reporting, all that noise turns into guesswork.
How do you know if your agents are actually performing well?
What’s dragging down customer experience?
Where are the gaps that cost you time, money, and loyalty?
That’s where contact center reporting steps in. It gives you real visibility into what’s working, what’s not, and what needs fixing, before your customers feel the impact.
In this guide, we’ll explore what contact center reporting really means, the types of reports you should be tracking, and the KPIs that matter most.
Let’s get into it.
What is contact center reporting?
Contact center reporting is the process of tracking and analyzing data from your customer interactions.
It tells you what’s really happening on the floor – how agents are performing, what customers are experiencing, and where your team needs support.
It’s how you move from guesswork to clarity.
Here’s the reality: the average contact center handles over 1,000 customer interactions per agent every month.
That’s a lot of conversations and a lot of room for things to go wrong. Without reporting, you’ll never know where the breakdowns are happening until customers start complaining.
Let’s say your team is hitting its average handle time (AHT) target, but your First Call Resolution (FCR) is slipping.
That could mean agents are rushing calls instead of solving problems. Or maybe your CSAT is trending down, but you’re still within SLA.
That’s a sign that something deeper is going on, maybe process complexity, maybe empathy gaps.
Reporting helps you catch those signals early.
It pulls data from tools like your CRM, IVR, ACD, and WFM platform, then highlights what needs attention. You can see:
- Which agents are struggling with compliance
- Where call volumes spike and wait times drag
- What topics keep coming up in repeat contacts
In short, contact center reporting helps you answer critical questions:
- Are we meeting service goals?
- Where are we losing time, money, or customers?
- Which agents need help or recognition?
And it’s not just about looking back. Reporting also helps you forecast future demand, schedule your team, and coach smarter.
Teams that use data-driven reporting are 20% more likely to meet their service level targets and 30% more likely to retain top-performing agents.
Bottom line: if you want to grow, improve, and compete, your reporting has to work just as hard as your agents.
Types of reports & when to use them
Every report in your contact center has a purpose. Some help you coach better. Others help you plan smarter. The best ones help you do both.
Let’s look at the three main types of contact center reports, along with detailed breakdowns of each:
1. Agent performance reports
These reports show you what your agents are doing on the floor, how they spend their time, how well they follow processes, and how effectively they support customers.

a. Agent availability report
This report tracks when agents are logged in, on break, available, or unavailable.
If customers are waiting too long in the queue, the problem might not be volume; it could be agent availability.
This report helps you spot shift gaps, monitor schedule adherence, and avoid over- or under-staffing during critical hours.
Example: If 30% of your agents are marked “unavailable” during peak call hours, you know it’s time to adjust break scheduling or revisit WFM forecasts.
b. Agent activity report
This report tracks daily metrics for each agent, including:
- Number of calls taken
- Average call duration
- Number of missed or declined calls
- Tickets resolved within SLA
- First Call Resolution (FCR)
- Number of unique customers handled
It gives a clear snapshot of each agent’s workload and efficiency.
Great for identifying top performers and those who might be overwhelmed or underperforming.
Example: An agent with low call volume but high AHT may need coaching on call handling or product knowledge.
c. Quality management report
This pulls QA scores based on scored interactions – voice, email, or chat.
What it covers:
- Script adherence
- Empathy and tone
- Accuracy of resolution
- Compliance requirements
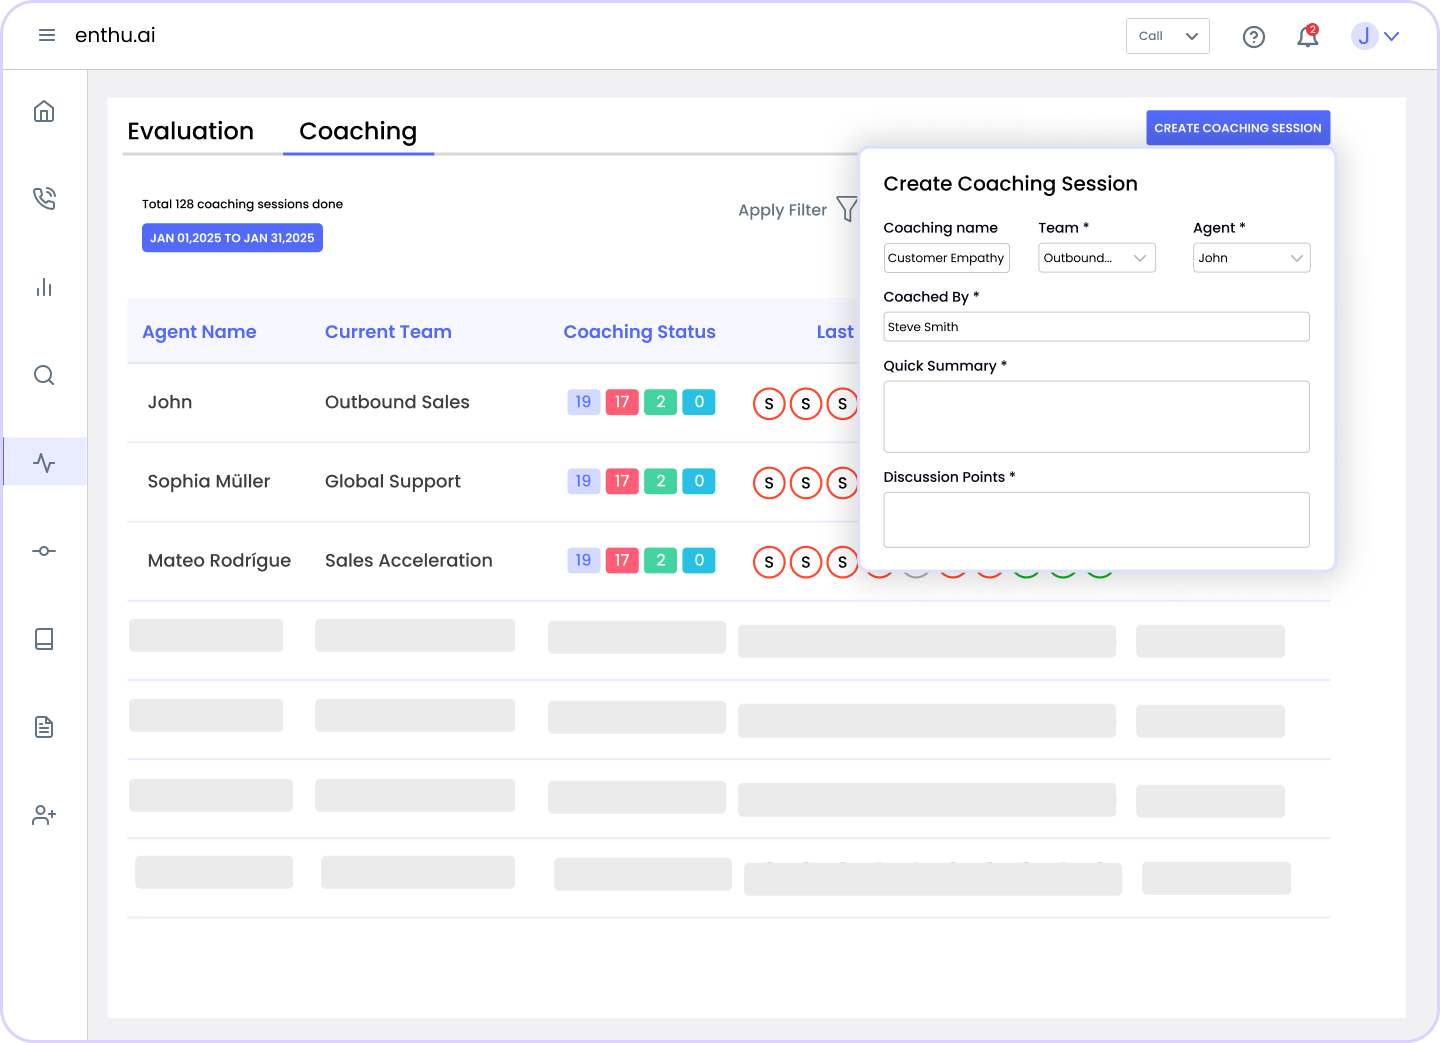
QA scores in Enthu.AI help you coach agents on what matters most – how they sound, how they solve problems, and whether they’re staying compliant.
Example: An agent with good CSAT but low QA may be pleasing customers but skipping critical steps like legal disclosures.
Adherence to the schedule report
Compares actual log-in and log-out times against scheduled hours. Tracks breaks, lunch, and time spent on non-call activities.
Even a few minutes of missed time per shift adds up. This report helps reduce shrinkage and increase staffing accuracy.
Example: If one team is consistently under 90% adherence, they may be struggling with late logins or long breaks, something you can fix quickly.
Occupancy rate report
Shows how much time agents are actively engaged on calls, wrap-up tasks, or other work versus idle time.
Low occupancy = wasted resources. High occupancy = agent burnout. You want balance.
Example: A team with 95 %+ occupancy may be overworked, leading to errors and lower service quality.
Call wrap-up time (after-call work)
Tracks how long agents take to finish tasks after each interaction, like notes, CRM updates, or follow-ups.
Too much time here can lower availability. Too little could mean incomplete records.
Example: If your top performer has a 3-minute wrap-up average (when the team norm is 1 minute), there may be a workflow or training gap.
2. Customer satisfaction reports
These reports help you understand how customers feel after interacting with your contact center and what that means for your business.
a. Customer feedback report
This pulls in results from post-call surveys and feedback forms. It tracks:
- CSAT (Customer Satisfaction Score)
- NPS (Net Promoter Score)
- CES (Customer Effort Score)
- Open-text comments (if available)
Customer feedback helps you tie agent performance to real customer experience, and reveals patterns you can’t see in internal data alone.
Example: A drop in CSAT for one queue might indicate a process issue, not just an agent problem.
b. Customer retention report
Shows how well your contact center is contributing to customer loyalty and long-term value. This report tracks:
- Repeat customers vs. churned customers
- Reasons for churn (if captured)
- Churn impact on revenue
It’s easier to keep a customer than win a new one. This report connects contact center experience to retention and bottom-line results.
Example: If churn is high in your loan servicing team, it may relate to poor follow-up or unclear communication during calls.
3. Contact center performance reports
These are your high-level, operational reports. They help you run a more efficient, scalable, and responsive contact center.
a. Service level agreement (SLA) report
Tracks how often you’re meeting service-level targets. Common SLA goals include:
- 80% of calls answered within 20 seconds
- Chats responded to within 30 seconds
- Emails replied to within 4 hours
Missing SLAs leads to poor CX, customer frustration, and increased call volume from repeat contacts.
Example: If SLA drops during a specific hour block daily, you might need to stagger lunch breaks better or add headcount.
b. Workforce management (WFM) report
Covers everything related to staffing, forecasting, and scheduling:
- Forecast accuracy
- Planned vs. actual staffing
- Absenteeism and schedule adherence
- Intraday performance metrics
This is your resource control center. It helps ensure you have the right number of agents at the right times without overstaffing and blowing your budget.
Example: A WFM report showing 20% overstaffing every weekend could save you thousands per month if corrected.
c. IVR performance report
Measures how effective your IVR system is at handling or routing calls.
This report Tracks:
- Call abandonment within IVR
- Menu navigation success rate
- Time spent in IVR
- IVR deflection rate (calls resolved without an agent)
Why it matters:
If your IVR is too long or confusing, customers drop off, or worse, get frustrated before even reaching a human.
Example: If 40% of customers are abandoning the IVR, you may need to simplify the menu or improve voice recognition accuracy.
Quick Reference: Contact Center Reporting Checklist
| Report Type | What It Shows | When to Use It | Why It Matters |
| Agent Availability Report | Agent login, break, idle status | During peak/off-peak hours | Helps with real-time staffing decisions and shift adherence |
| Agent Activity Report | Calls handled, AHT, FCR, ticket counts | Daily or weekly team reviews | Identifies top and low performers by workload and efficiency |
| Quality Management Report | QA scores by interaction | During coaching or QA reviews | Flags process gaps and compliance issues |
| Schedule Adherence Report | Actual vs. planned shifts | End of day/week | Reduces shrinkage, improves forecasting |
| Occupancy Rate Report | Time agents are actively engaged | Weekly or during WFM reviews | Balances productivity vs. burnout |
| Call Wrap-Up Time (ACW) | Post-call processing time | Daily for agent performance tuning | Pinpoints workflow inefficiencies or coaching needs |
| Customer Feedback Report | CSAT, NPS, CES | After survey cycles | Measures customer sentiment after service |
| Customer Retention Report | Repeat vs. churned customers | Monthly or quarterly | Links customer experience to revenue and loyalty |
| SLA Report | SLA target vs. actual | Daily/weekly ops reports | Maintains service promise and customer expectations |
| Workforce Management Report | Staffing, absenteeism, forecast accuracy | Weekly or shift planning | Ensures right staffing at the right time |
| IVR Performance Report | Drop-offs, deflection rate, menu success | Monthly or after IVR updates | Improves self-service and reduces live-agent load |
Don’t treat reporting like a one-time event. It should be baked into your daily, weekly, and monthly rhythm.
How to Use Reports to Improve Agent Performance?
Reports aren’t just for leadership dashboards.
They’re one of the most powerful tools you have to coach better, train smarter, and help agents hit their goals.
But here’s the catch, data alone doesn’t drive performance. It’s how you use that data that makes the difference.
Here’s how to turn your reports into meaningful improvements for your team.
1. Spot coaching opportunities early
Let’s say your QA report shows an agent is consistently missing compliance disclosures. Or their call wrap-up time is 3x longer than the team average. That’s your coaching cue.
Instead of generic feedback like “You need to improve,” you can now say,
“In your last 10 calls, 7 missed the compliance script. Let’s walk through one together.”
Pro Tip: Always bring data to 1:1s. It turns feedback from emotional to objective.
2. Set clear goals with data to back them
Want your team to improve CSAT or empathy scores?
Use performance reports to set baseline numbers, then track progress weekly.
Example:
Baseline CSAT: 62%
Target: 70% in 4 weeks
Action: Weekly review of QA data + refresher training
Agents are more motivated when they can see their growth in black and white.
3. Personalize coaching plans
Not every agent struggles with the same thing. One might need help with tone and empathy.
Another might rush through calls and miss resolution steps.
Reports help you group agents by behavior and tailor coaching accordingly.
Tip: Use QA reports + CSAT together. Low QA and low CSAT? That’s a red flag.
High CSAT but low QA? That’s a coaching opportunity before compliance issues surface.
4. Reward top performers – based on facts
Don’t rely on gut feel when recognizing great work. Use your agent activity and quality reports to find agents who consistently:
- Handle more calls with high FCR
- Score high on empathy and compliance
- Maintain strong CSAT
Recognition backed by data builds trust. It also sets a clear performance benchmark for others.
5. Make reporting part of your coaching rhythm
If reporting only happens once a month, you’re missing the point.
Weekly or bi-weekly performance reviews help build accountability and momentum.
Try this:
- Mondays: Review last week’s reports
- Wednesdays: Coach one key skill based on the data
- Fridays: Shout out top metrics in team huddles
Reporting gives you the “what.” Coaching turns it into the “how.”
When used consistently, the two work hand-in-hand to build stronger, more confident agents.
10 Key Metrics and KPIs in Contact Center Reporting
Reporting isn’t just about pulling numbers; it’s about tracking the right numbers. And in a contact center, not all metrics carry the same weight.
Let’s walk through the 10 most important metrics every contact center should be measuring and why they matter.
1. First Call Resolution (FCR)
First Call Resolution measures whether customer issues are solved on the first attempt, without the need for a follow-up or transfer.
It’s one of the clearest indicators of both agent effectiveness and customer satisfaction.
If your FCR is low, it usually means agents aren’t equipped to fully resolve issues or the process is broken.
That leads to longer queues, frustrated customers, and rising operational costs.
On the flip side, a high FCR means agents are well-trained, confident, and supported by the right systems.
Why it matters:
FCR directly impacts repeat call volume and customer satisfaction. If you’re only tracking handle time without FCR, you’re missing half the story.
Formula:
FCR = (Calls Resolved on First Contact / Total Calls) × 100
2. Average Handle Time (AHT)
AHT calculates the average time an agent spends on a single interaction, including talk time, hold time, and after-call work (ACW).
It’s often misunderstood as a productivity metric, but speed isn’t always the goal.
Too high? You may have training or process issues. Too low? You could be sacrificing quality for speed.
Why it matters:
Used correctly, AHT helps balance efficiency and quality. It’s best viewed alongside FCR and CSAT to give proper context.
Formula:
AHT = (Talk Time + Hold Time + After-Call Work) / Total Calls
3. Customer Satisfaction Score (CSAT)
CSAT is usually captured through a quick post-call survey asking, “How satisfied were you with your experience today?”
Customers rate their experience on a scale, often from 1 to 5 or 1 to 10.
While it’s simple, it’s incredibly valuable if you look beyond the number.
Pay attention to trends across agents, teams, or contact reasons.
Is CSAT dropping during a specific shift? Does it correlate with long hold times?
Why it matters:
It’s one of the few metrics that directly captures the customer’s voice. Consistently low CSAT usually points to deeper service or process issues.
Formula:
CSAT = (Number of Satisfied Responses / Total Survey Responses) × 100
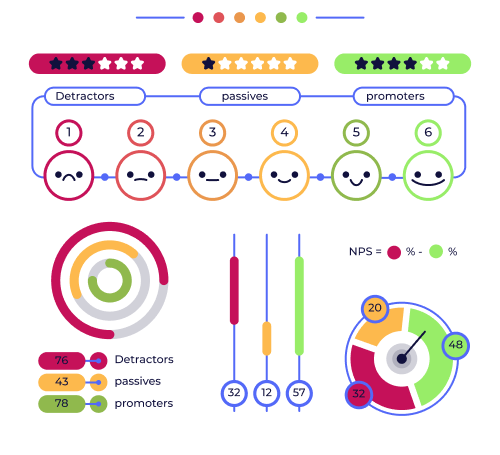
4. Net Promoter Score (NPS)
Unlike CSAT, which focuses on a single interaction, NPS reflects how customers feel about your brand overall.
It’s measured by asking, “How likely are you to recommend us to a friend or colleague?”
The responses are categorized as:
- Promoters (9–10)
- Passives (7–8)
- Detractors (0–6)
Subtract the percentage of detractors from promoters, and you get your NPS.
Why it matters:
NPS gives you a broader view of customer loyalty and long-term satisfaction. It’s especially useful for teams handling high-value accounts or complex journeys.
Formula:
NPS = % Promoters (9–10) – % Detractors (0–6)
3. Service level
Service Level measures the percentage of calls answered within a specific time threshold, like answering 80% of calls within 20 seconds.
Most centers use this metric to manage wait times and agent availability.
If your SL is dipping, it could mean poor forecasting, not enough agents, or slow IVR menus that keep customers stuck too long before reaching help.
Why it matters:
It’s a foundational operations metric. You can’t maintain a great customer experience without good service levels.
Formula:
Service Level = (Calls Answered Within Threshold / Total Calls) × 100
4. Abandonment Rate
This tracks how many callers hang up before they ever speak to an agent.
High abandonment rates usually point to long wait times, confusing IVRs, or inconsistent agent availability.
Customers are impatient, and if they bail out, they may not come back.
Why it matters:
This is a direct hit to customer experience. Every abandoned call is a lost opportunity to help, convert, or retain a customer.
Formula:
Abandonment Rate = (Abandoned Calls / Total Incoming Calls) × 100
5. Forecast Accuracy
Forecast Accuracy compares predicted call volumes to actuals.
Even a 5–10% error rate can cause serious overstaffing or understaffing, especially during peak hours.
Most workforce managers track this weekly to ensure resource planning stays aligned with real demand.
Why it matters:
Inaccurate forecasting leads to either wasted budget or burned-out agents. Neither is good.
Formula:
Forecast Accuracy = [(Forecast – Actual) / Actual] × 100
6. Quality Assurance (QA) Score / IQS
Your Internal Quality Score (IQS) comes from scored evaluations of agent interactions.
With Enthu.AI QA teams can easily analyse the customer conversation calls and score them based on tone, compliance, resolution, and other criteria.
AI software automatically samples the calls and scores the agents, cutting out the huge manual effort.
A high IQS means agents are following processes, delivering value, and staying within compliance.
Why it matters:
IQS helps you catch mistakes before they become complaints or worse, regulatory issues. It’s also a great coaching tool when paired with agent scorecards.
7. Agent Utilization Rate
Utilization tracks how much of an agent’s logged-in time is spent actively handling customer work (calls, chats, ACW).
It’s not about pushing agents to 100%. In fact, that’s a red flag for burnout.
Why it matters:
This metric helps you find the sweet spot between productivity and sustainability. Ideally, most agents should be in the 75–85% range.
Formula:
Utilization = (Time on Calls + ACW) / Total Logged-In Time × 100
8. Customer effort score (CES)
CES asks one simple question: “How easy was it to resolve your issue today?”
It tells you whether customers had to fight to get help or if the process felt smooth and intuitive.
CES is often overlooked, but it’s one of the best predictors of loyalty.
Why it matters:
Customers will put up with a long wait or even a mistake, if the resolution process is painless. High effort = high churn risk.
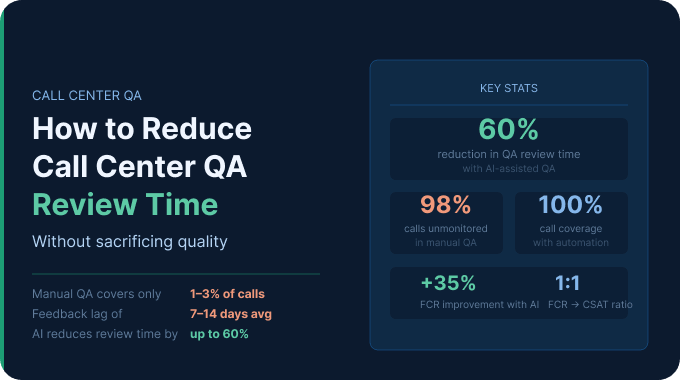
E. How does Enthu.AI give you 100% call coverage and reporting?
As soon as a call ends, Enthu.AI automatically pulls in the recording.
It then transcribes the audio using advanced speech-to-text technology, making every word searchable and analyzable.
After that, it scores the conversation based on your QA parameters- like compliance adherence, empathy, resolution quality, and process accuracy.
These scores aren’t based on generic AI rules. They follow the exact scoring logic your team already uses.
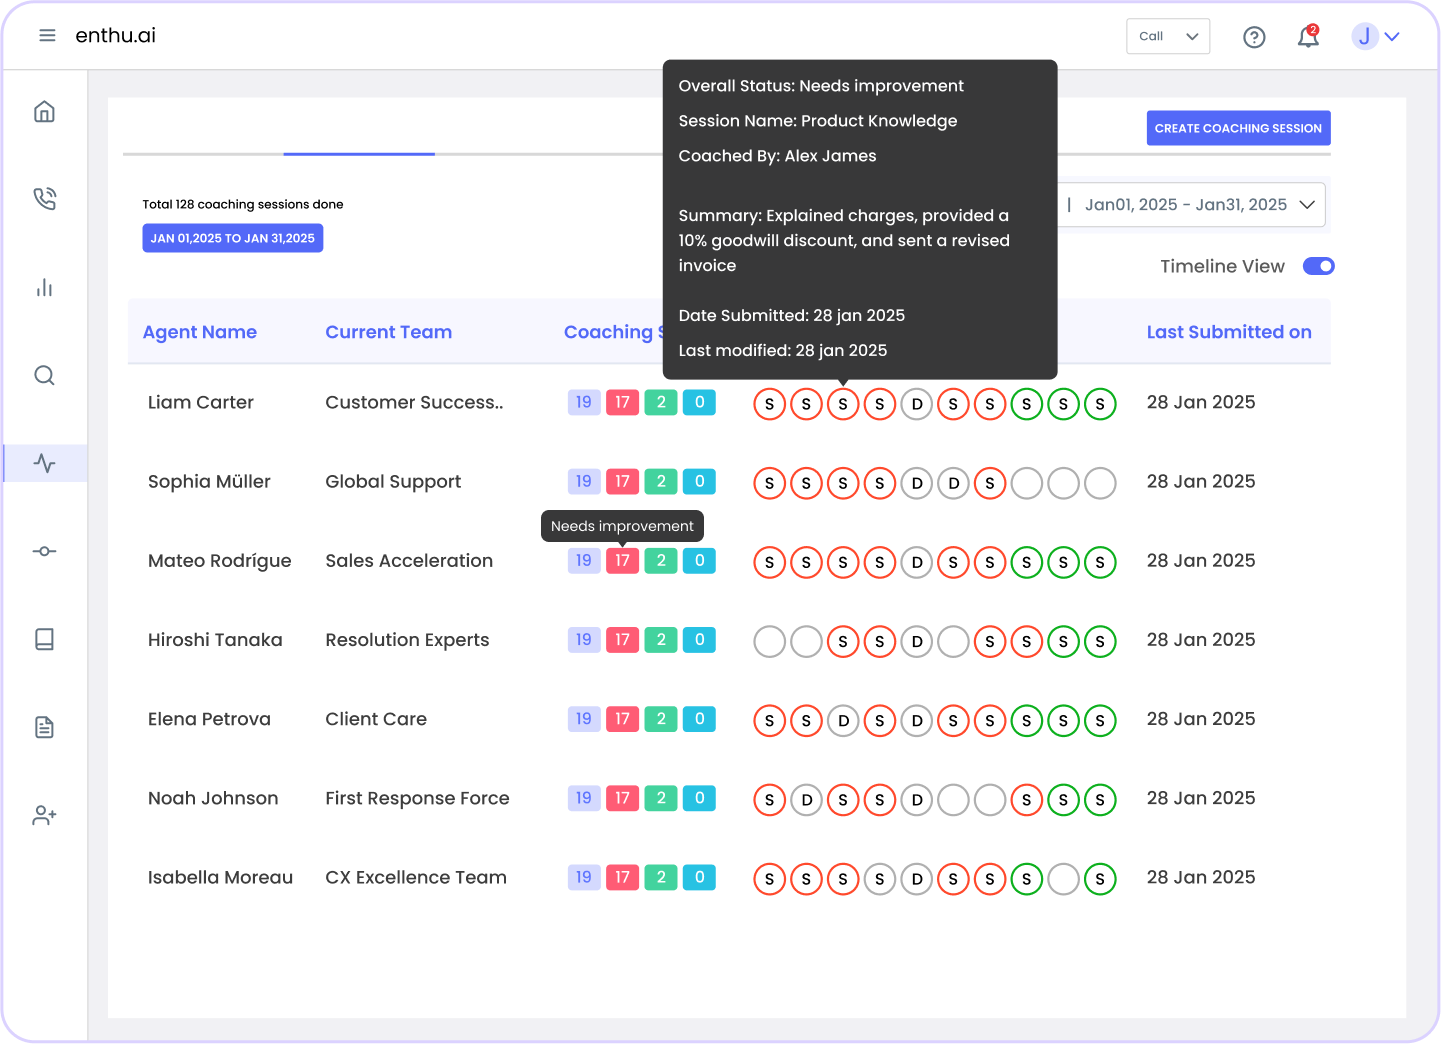
Once scored, Enthu.AI generates detailed agent performance reports you can access directly in the dashboard or through Power BI for deeper analysis.
You can track performance trends over time, compare agents, and instantly spot coaching opportunities.
Enthu.AI also flags high-risk calls, missed scripts, or behavioral issues, so you can act fast before problems escalate.
Instead of sampling a handful of calls, you get full visibility across 100% of interactions, with auo QA, and visual contact center reports.
FAQs
1. What are the 4 elements of contact center?
People, processes, technology, and data are the four main components of a contact center, including agents, supervisors, workflow management, quality assurance, software, telephony, AI tools, and analytics for performance monitoring and improvement.
2. What is the reporting structure of a call center?
The reporting structure of a call center typically includes:
- Frontline staff members responsible for client contacts are known as call center agents. Supervisors and team leaders oversee agents, monitor output, and address issues.
- The call center manager is responsible for overseeing staff, managing daily operations, and implementing process improvements.
- Operations Manager: responsible for strategic planning, overseeing multiple teams, and improving call center productivity.
- The director of customer service, who reports to executives or senior leadership, aligns call center objectives with corporate goals.
Each level provides guidance and support to ensure smooth operations and service quality.
3. What are the 4 pillars of contact center?
The four pillars of a contact center are:
- Customer Experience: Ensuring high-quality service and satisfaction across all touchpoints.
- Agent Productivity: Optimizing agent performance through training, support, and effective tools.
- Technology and Automation: Utilizing advanced systems like AI, CRM, and automation to streamline processes.
- Data and Analytics: Leveraging insights to monitor performance, improve decision-making, and enhance overall efficiency


 On this page