Most sales managers track something. But tracking the wrong things, or tracking the right things in the wrong way, is just as problematic as flying blind.
Yet most coaching programs fail not because of poor effort, but because teams don’t know which metrics actually signal progress.
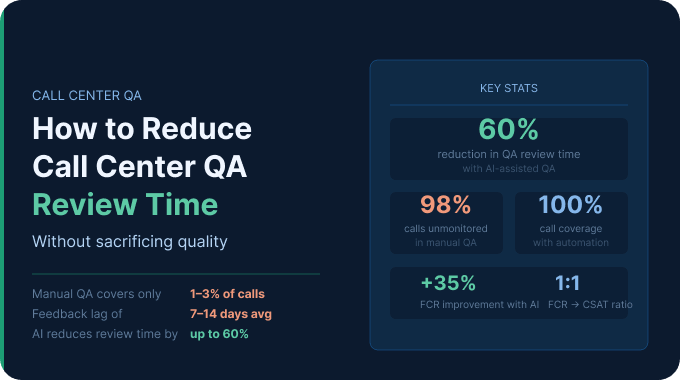
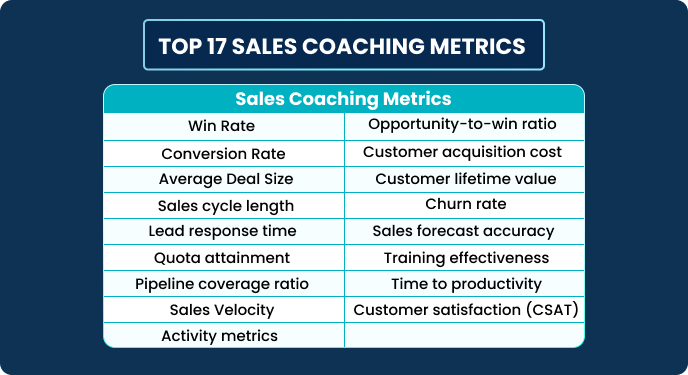
This guide fixes that. We’ve compiled the 17 most important sales coaching metrics, explained how to calculate them, and clarified why each one matters to your bottom line.
What are sales coaching metrics and why do they matter?
Sales coaching metrics are quantifiable data points that tell you how well your reps are performing, where they’re struggling, and what kind of coaching will actually move the needle.
They’re not just vanity numbers. The right metrics help you build targeted coaching plans, spot skill gaps early, and make sure your training investments are paying off. Without them, sales coaching becomes guesswork – and expensive guesswork at that.
Think of it this way: you wouldn’t coach a tennis player without watching their serve, their footwork, and their game stats. Sales is no different.
How do you choose the right sales coaching metrics?
The best metrics align directly with your business goals, your sales process, and the stage of your team’s development.
Focus on metrics that are actionable (you can actually change them), measurable (you can track them consistently), and relevant (they connect to revenue or customer success). Avoid chasing metrics that look good in a report but don’t connect to real performance outcomes.
Now, let’s get into the full list.
The 17 sales coaching metrics that actually matter
1. Win Rate – Are your reps actually closing?
Win rate measures the percentage of opportunities that turn into closed-won deals.
It’s one of the clearest indicators of how effective your sales process – and your reps – really are.
Formula: (Closed-Won Deals ÷ Total Deals Closed) × 100
For example, if a rep closes 20 deals out of 100 total, their win rate is 20%. According to HubSpot research, the average B2B sales win rate hovers around 20–30%, though this varies significantly by industry.
A consistently low win rate suggests reps need coaching on objection handling, demo delivery, or closing techniques. A suddenly dropping win rate often signals a market shift or a process breakdown that needs immediate attention.
2. Conversion Rate – where are leads dropping off?
Conversion rate measures the percentage of leads that successfully move to the next stage of your pipeline – or ultimately become customers.
Formula: (Number of Conversions ÷ Total Leads) × 100
Unlike win rate (which focuses on the final stage), conversion rate can be tracked at every stage of your funnel. This gives you surgical visibility into exactly where prospects are being lost – whether it’s at the first call, during the demo, or at the proposal stage.
If your reps are generating hundreds of leads but converting only a small fraction, the problem likely lives in qualification, follow-up, or pitch delivery – all highly coachable areas.
3. Average Deal Size – are your reps selling to their full potential?
Average deal size (also called Average Sale Price or ASP) is the average revenue value of each closed deal.
It tells you whether reps are maximizing each opportunity or leaving money on the table.
Formula: Total Revenue from Closed Deals ÷ Number of Deals Closed
If some reps consistently close deals 30% above your team’s average while others fall below, that’s a coaching signal. The high performers may be better at upselling, identifying larger accounts, or building business cases for premium tiers.
Tracking this metric over time also helps with revenue forecasting and quota setting – two things that become very messy when your data is unreliable.
4. Sales cycle length – Is your process moving too slowly?
Sales cycle length measures the average number of days between first contact and a closed deal.
A long cycle isn’t always bad – enterprise deals take time – but unexplained length increases almost always point to a coaching opportunity.
Formula: Total Duration of All Sales Cycles ÷ Number of Closed Deals
Bottlenecks in the sales cycle often cluster around specific stages: proposal delivery, legal review, or multi-stakeholder sign-off. Once you identify where deals stall, you can coach reps on how to navigate those moments more efficiently.
5. Lead response time – Are you losing deals before they start?
Lead response time measures how quickly your reps follow up with new leads, typically in minutes.
This one is deceptively simple – and massively impactful.
A landmark study by Dr. James Oldroyd at MIT found that contacting a lead within 5 minutes of their inquiry makes them 21 times more likely to enter the sales process than if you wait 30 minutes. Twenty-one times. That’s not a rounding error.
How to track it: Measure the average time between lead creation and first meaningful outreach across your team.
If your average lead response time is hours or days, this is likely your highest-leverage coaching fix. Help reps prioritize inbound lead alerts, use pre-built outreach templates, and set up automated reminders to act fast.
6. Quota attainment – Who’s hitting their number?
Quota attainment measures the percentage of assigned sales targets that a rep or team actually achieves.
It’s the most direct measure of whether your coaching is translating into results.
Formula: (Actual Revenue ÷ Quota) × 100
According to Salesforce’s State of Sales report, only about 24–33% of reps are expected to hit quota in a given year. Quota attainment data helps you identify which reps are chronically underperforming and what pattern of support has helped similar reps improve.
It also reveals whether quotas themselves are realistic – an important distinction when nearly everyone misses.
7. Pipeline coverage ratio – Do you have enough in the funnel?
Pipeline coverage measures the total value of your current pipeline relative to your sales quota.
It tells you whether there’s enough opportunity flowing through to realistically hit your targets.
Formula: Total Pipeline Value ÷ Total Sales Target
Most sales leaders aim for a pipeline coverage ratio of 3x to 5x their quota. Why? Because not every deal closes, so you need multiple opportunities to absorb losses and still land on target.
If coverage drops below 3x, it’s often a sign that reps need coaching on prospecting and top-of-funnel activity. If it’s above 8x, deals may be sitting in the pipeline too long or being over-inflated.
8. Sales Velocity – How fast is revenue actually coming in?
Sales velocity measures how quickly your team generates revenue by combining four key variables into one number.
It’s arguably the most comprehensive single metric in sales.
Formula: (Number of Opportunities × Average Deal Value × Win Rate) ÷ Average Sales Cycle Length
A higher sales velocity means your team is generating more revenue faster. Each component of the formula is a potential lever – coaching reps on closing rates, deal size, pipeline volume, or cycle efficiency will all move the velocity number.
Gartner research highlights that top-performing B2B sales teams consistently focus on velocity as a core planning metric, not just revenue bookings.
9. Activity metrics – Are reps doing the work?
Activity metrics track the specific sales behaviors your reps take each day – calls made, emails sent, demos booked, meetings held, proposals sent.
These are the inputs that drive all the outcome metrics above.
They matter especially for coaching newer reps, where skill is still developing, and consistent activity is the foundation of eventual results.
How to measure: Most CRMs (Salesforce, HubSpot, Pipedrive) automatically log activity data. Review it weekly to spot reps who are underperforming on inputs before their output numbers collapse.
One important nuance: high activity without results is a quality problem. Low activity with good results suggests potential for even greater performance. Both patterns deserve targeted coaching.
10. Opportunity-to-win ratio – How efficiently are reps converting qualified leads?
The opportunity-to-win ratio tracks what percentage of qualified opportunities (not just raw leads) ultimately result in closed-won deals.
This is a more precise signal than a broad conversion rate.
Formula: (Closed-Won Opportunities ÷ Total Closed Opportunities) × 100
This metric is especially useful at the team level. If one rep converts 40% of their qualified opportunities while the team average is 22%, you can study what they do differently – how they run discovery calls, structure proposals, handle pricing objections – and build that into your coaching curriculum.
11. Customer acquisition cost (CAC) – Are you spending too much to win business?
CAC measures the average cost to acquire a new customer, combining all sales and marketing expenses over a given period.
It’s a business health metric as much as a sales coaching metric.
Formula: Total Sales + Marketing Expenses ÷ Number of New Customers Acquired
Customer acquisition costs vary widely by industry and deal size; what matters most to track is the trend and the ratio of CAC to Customer Lifetime Value.
Tracking CAC by team segment also reveals which channels and rep approaches bring in customers most cost-effectively – crucial for scaling what works.
12. Customer lifetime value (CLV) – Are you selling to the right customers?
CLV predicts the total revenue a business can expect from a single customer account over the entire relationship. It reframes sales not as a transaction, but as the start of a long-term revenue stream.
Formula: Average Annual Customer Revenue × Average Customer Lifespan (in years)
The CLV-to-CAC ratio is one of the most important indicators of business sustainability. A healthy ratio is generally 3:1 or higher – meaning each customer you acquire should generate at least three times what you spent to win them.
For coaching, CLV helps identify which customer segments, company sizes, or industries generate the most value over time – so you can coach reps to focus prospecting efforts on the highest-return targets.
13. Churn rate – Are customers staying after the sale?
Churn rate measures the percentage of customers who cancel or stop purchasing within a given period.
High churn is often a signal that deals were closed poorly – wrong customers, misaligned expectations, or overselling.
Formula: (Customers Lost in Period ÷ Customers at Start of Period) × 100
According to research by Bain & Company, a 5% increase in customer retention can increase profits by 25–95%. Churn rate brings the quality of your sales – not just the quantity – into focus.
If churn is high among deals closed by specific reps, it’s often a sign of misqualification or overpromising during the sales process. Both are coachable behaviors.
14. Sales forecast accuracy – Can you trust your own predictions?
Sales forecast accuracy measures how closely your predicted revenue matches actual revenue over a given period.
Poor forecast accuracy is one of the most costly operational problems a sales organization can have.
How to measure: Calculate the percentage difference between forecasted and actual revenue each quarter. Teams that consistently land within ±10% of forecast are considered high-performing.
Research by Aberdeen Group found that best-in-class companies achieve forecast accuracy of 80% or higher, compared to industry averages of 50–60%. When forecasts are unreliable, teams make bad resource decisions – hiring too much, investing in the wrong markets, or missing board expectations.
Coaching reps on accurate deal qualification, honest stage progression, and realistic close timelines dramatically improves forecast quality.
15. Training effectiveness – Is your coaching actually working?
Training effectiveness measures the impact of your coaching and training programs on actual sales performance.
Without this metric, you’re essentially spending on coaching with no way to know if it’s working.
How to measure: Track performance metrics (win rate, conversion rate, average deal size) before and after a specific training intervention. Calculate the average improvement per participant.
A practical approach: assess reps on a specific skill (say, discovery call quality), run a targeted coaching sprint, then reassess 30 days later. The delta is your effectiveness score.
This metric also helps justify coaching investment to leadership – which, let’s be real, becomes important the moment budget conversations start.
16. Time to productivity – How fast are new reps getting up to speed?
Time to productivity (also called ramp time) measures how long it takes a new sales hire to reach full performance – typically defined as hitting 100% of their quota.
How to measure: Track the number of months from hire date to first full-quota attainment for each cohort of new hires.
According to research by Bridge Group, the average sales rep ramp time in B2B SaaS is 3.2 months, though this can stretch to 6 months or more for enterprise sales roles. Every week, a rep underperforms costs real revenue – so shortening ramp time has direct financial value.
Structured onboarding, shadowing programs, and targeted early coaching on product knowledge and objection handling are the biggest levers to pull here.
17. Customer satisfaction (CSAT) – Are customers happy with how they were sold to?
CSAT measures how satisfied customers are with their interaction with your sales team, typically collected via post-sale surveys.
It’s the metric that bridges sales and customer success.
Formula: (Number of Satisfied Responses ÷ Total Survey Responses) × 100
Most companies use a 1–5 or 1–10 scale, counting scores of 4–5 (or 8–10) as “satisfied.” Industry benchmarks from the American Customer Satisfaction Index show that top-performing B2B companies consistently score above 80%.
Low CSAT scores from the sales phase often indicate high-pressure tactics, poor expectation-setting, or misaligned communication styles – all of which can be addressed through focused coaching.
How to build a sales coaching dashboard around these metrics?
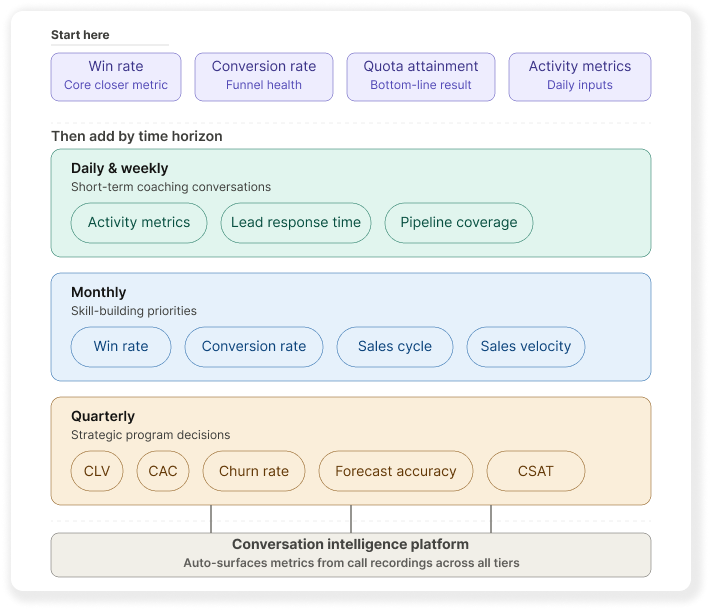
Tracking 17 metrics doesn’t mean panicking over 17 dashboards. Start with a core set – win rate, conversion rate, quota attainment, and activity metrics – and add others as your coaching program matures.
A practical framework is to group your metrics by time horizon. Daily and weekly metrics (activity, lead response time) guide short-term coaching conversations. Monthly metrics (win rate, conversion rate, sales cycle) inform skill-building priorities. Quarterly metrics (CLV, CAC, forecast accuracy) shape strategic program decisions.
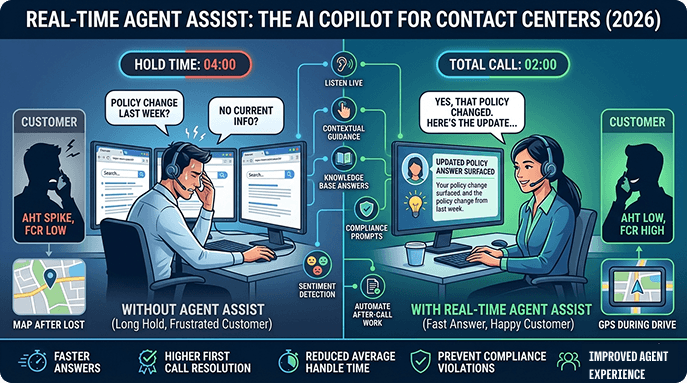
Tools like conversation intelligence platforms can automatically surface many of these metrics from call recordings, making it far easier to connect coaching input to performance output without manual data gathering.
What good sales coaching looks like when you track the right metrics?
Metrics without action are just spreadsheet decorations. The real value comes from building coaching conversations around specific data points.
For example, if a rep’s win rate drops from 25% to 15% over two months while their activity is high, the issue probably isn’t effort – it’s skill. That points to a coaching conversation about deal qualification, objection handling, or closing approach, not a motivation pep talk.
Specific metrics create specific conversations. Specific conversations create specific improvements. And specific improvements, over time, compound into a sales team that consistently outperforms its targets.

Final thought
The best sales coaching programs share one trait: they treat data as a coaching tool, not a reporting obligation.
Pick the metrics that align with your goals, establish baselines before you start coaching, and revisit your data regularly. As Harvard Business Review notes, organizations that connect coaching directly to performance data consistently outperform those that rely on intuition alone.
Your sales team doesn’t need more coaching. It needs better-targeted coaching – and that starts with measuring the right things.

 On this page