Sales is a multifaceted process that involves building relationships, providing solutions, communication, and negotiation, and finally – closing the deal.
All of these activities contribute to the ultimate goal of a sale, but their effectiveness can be subjective and difficult to measure without data and the right metrics.
The lack of specific sales performance metrics makes it difficult to pinpoint the root causes of declining sales and areas of improvement.
Sales metrics provide that objective measure to identify areas of improvement, ultimately leading to a more successful sales operation.
But which key metrics should you track, and why?
We’ve compiled 13 crucial sales performance metrics that you should track in 2026 to assess the effectiveness of your sales process and make informed decisions.
Let’s go
A. What Are Sales Performance Metrics?
Sales performance metrics are quantitative indicators that measure specific aspects of the sales process from lead generation to deal closure.
Unlike broader KPIs, these metrics offer granular insights into each sales funnel stage.
For instance, revenue growth is a KPI because it tells you about the overall performance of your company.
Sales performance metrics, like the number of leads generated, measure a particular aspect of the sales process.
B. Top 13 Sales Performance Metrics You Should Track in 2026
Here are the top 13 sales performance metrics you should track in 2026 to close more deals and boost your revenue:
1. Sales Growth
What it is: The percentage increase in sales over a specific period, measuring revenue momentum.
Why track it: Assesses the overall health of your sales organization and helps measure progress toward sales goals while identifying performance trends.
How to calculate:
Sales Growth Rate=Current Period Sales−Prior Period Sales/Prior Period Sales×100
Example: Your company’s sales were $100,000 in January and $125,000 in February.
- Sales Growth Rate = ($125,000 – $100,000) / $100,000 × 100 = 25%
- This indicates a 25% increase in sales from the previous month.
How to use: Evaluate overall business health and momentum. A 25% growth rate (e.g., from $100,000 to $125,000) indicates a strong positive trajectory.
2. Sales Target Attainment
What it is: Actual sales as a percentage of your predetermined sales target for a given period.
Why track it: Measures goal alignment and reveals whether targets are realistic. As Harvard Business Review notes, “When 10%-20% of salespeople miss goals, the problem might be the salespeople. But when most salespeople miss, the problem is their goals.”
How to calculate:
Sales Target Attainment=Sales for Current PeriodSales Target×100
Example: Your monthly sales target was $5,000 and your actual sales were $4,000.
- Sales Target Attainment = ($4,000 / $5,000) × 100 = 80%
- This shows you achieved 80% of your sales target for that month.
How to use: Assess whether sales teams are meeting expectations and determine if quota adjustments are needed. Low widespread attainment signals unrealistic targets.
3. Sales by Region
What it is: Sales performance measured across different geographic areas (country, state, city, or custom territories).
Why track it: Identifies regional performance differences that inform resource allocation and market-specific strategies.
How to calculate: Segment sales data by geographic region using your CRM, tracking total sales amount per territory within specific timeframes.
Example: Your Q4 2025 regional breakdown shows:
- West Coast: $500,000 (50% of total sales)
- East Coast: $200,000 (20% of total sales)
- Midwest: $300,000 (30% of total sales)
How to use: Reallocate resources to high-performing regions, identify underperforming markets for targeted campaigns, or adjust product offerings based on regional preferences.

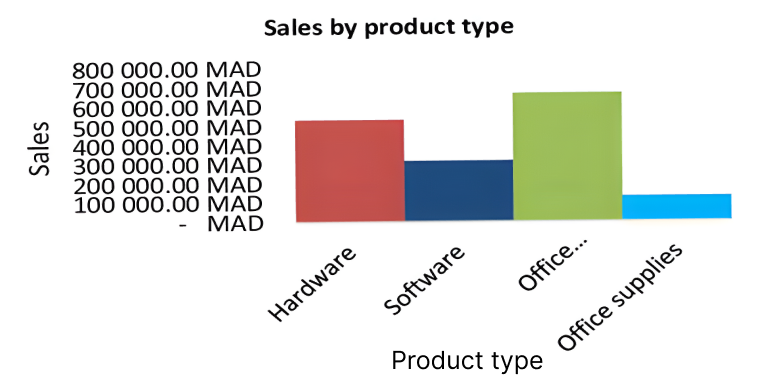
4. Sales by Product
What it is: Sales success measured for specific products or services in your portfolio.
Why track it: Identifies your best-performing offerings and informs product development, marketing focus, and pricing decisions.
How to calculate: Segment sales data by product/service using CRM reports showing sales numbers for each offering.
Example: Your SaaS company’s annual sales breakdown:
- Enterprise Plan: $2M (66% of revenue)
- Professional Plan: $800K (27% of revenue)
- Basic Plan: $200K (7% of revenue)
How to use: Double down on top performers, phase out underperformers, and guide inventory, development, and marketing priorities.
5. Lead Conversion Rate
What it is: The percentage of leads that convert into paying customers.
Why track it: Evaluates the effectiveness of your lead generation and sales qualification strategies. Poor conversion rates may indicate communication skill gaps.
How to calculate:
Lead Conversion Rate=Number of Leads Converted/Total Number of Leads×100
Example:
- Your website generated 100 leads last month, and 20 converted into paying customers.
- Lead Conversion Rate = (20 / 100) × 100 = 20%
How to use: Identify bottlenecks in the sales process. Use speech analytics software to find communication patterns that lead to successful closes and improve training programs.
6. Customer Acquisition Cost (CAC)
What it is: The total cost of acquiring a new customer, including marketing, sales, and operational expenses.
Why track it: Reveals how efficiently you’re acquiring customers and whether you need more cost-effective strategies.
How to calculate:
CAC=Cost of Sales+Cost of Marketing/Number of New Customers
Example: In Q1 2026, you spent:
- Sales costs (salaries, commissions): $50,000
- Marketing costs (ads, content, tools): $30,000
- New customers acquired: 40
CAC = ($50,000 + $30,000) / 40 = $2,000 per customer
How to use: Compare CAC against Customer Lifetime Value to ensure profitable customer acquisition. High CAC signals the need for strategy optimization.
7. Customer Lifetime Value (CLV)
What it is: The predicted total revenue a single customer will generate throughout their entire relationship with your business.
Why track it: Helps understand long-term customer value and justify investments in customer service, retention, and loyalty programs.
How to calculate:
CLV=Customer Value×Average Customer Lifespan
Example: Your SaaS customers:
- Pay $200/month on average
- Stay for an average of 36 months (3 years)
How to use: Create retention strategies, determine acceptable CAC levels, and prioritize high-value customer segments.
8. Average Purchase Value
What it is: The average amount of money a customer spends per transaction.
Why track it: Shows revenue generated per customer interaction and identifies opportunities to increase transaction size.
How to calculate:
Average Purchase Value=Total Revenue/Number of Purchases
Example: Your e-commerce store in November 2025:
- Total revenue: $150,000
- Number of purchases: 500
Average Purchase Value = $150,000 / 500 = $300 per transaction
How to use: Develop upselling and cross-selling strategies to increase customer spending per transaction.
9. Sales Cycle Length
What it is: The average time from initial lead generation to contract signing and deal closure.
Why track it: Sales cycle uncovers bottlenecks in your sales process and highlights areas needing improvement.
How to calculate: Sales Cycle Length=∑(Sale Closed Date−Lead Created Date)/Number of Deals
Example: You closed 10 deals in December:
- Total days across all deals: 450 days
- Average = 450 / 10 = 45 days
How to use: Identify where deals stall, streamline qualification processes, and forecast revenue timing more accurately.

10. Opportunity-to-Win Ratio
What it is: The percentage of sales opportunities that convert to closed deals.
Why track it: Measures sales process effectiveness and acts as a quality assurance check for your sales funnel.
How to calculate:
Opportunity Win Rate=Number of Won Opportunities/Number of Closed Opportunities×100
Example: In Q4 2025, your team:
- Created 100 qualified opportunities
- Closed 30 as won deals
- Lost 70 opportunities
Win Rate = (30 / 100) × 100 = 30%
How to use: Low ratios indicate salespeople are pursuing unqualified prospects or that qualification procedures need tightening.
11. Churn Rate
What it is: Churn rate percentage of customers who cancel subscriptions or stop doing business with you within a specific period.
Why track it: Determines customer retention effectiveness and identifies reasons for customer departure. A high turnover rate implies poor customer service. It might also indicate product dissatisfaction.
How to calculate:
Churn Rate=Lost Customers/Total Customers at Start of Period×100
Example: You started January 2026 with 250 customers and lost 10 by month-end.
- Monthly Churn Rate = (10 / 250) × 100 = 4%
- Annual churn rate would be approximately 48% if this continues
How to use: Investigate causes of high churn (poor service, product dissatisfaction). Aim for 5% or lower; anything above 10% requires immediate attention.
12. Pipeline Coverage
What it is: The ratio of potential revenue in your sales pipeline compared to your sales quota.
Why track it: Forecasts future sales and assesses whether you have sufficient opportunities to meet targets.
How to calculate:
Pipeline Coverage=Total Pipeline Value/Total Quota
Example: For Q1 2026:
- Your quarterly quota: $500,000
- Current pipeline value: $1,500,000
- Pipeline Coverage = $1,500,000 / $500,000 = 3x coverage
How to use: Analyze alongside win rates, deal size, and cycle length to assess lead quality and overall sales health. Insufficient coverage signals need for more prospecting.
13. Quota Attainment
What it is: The percentage of sales quota achieved by your team or individual salespeople during a specific period.
Why track it: Evaluates team and individual performance while identifying sales training needs.
How to calculate:
Quota Attainment=Actual SalesSales Quota×100
Example: Rep performance for December 2025:
- Rep A: $50,000 actual / $40,000 quota = 125% attainment
- Rep B: $30,000 actual / $40,000 quota = 75% attainment
- Rep C: $42,000 actual / $40,000 quota = 105% attainment
- Team average: 102% attainment
How to use: Assess individual and team performance, identify coaching opportunities, and determine if quotas need adjustment based on realistic achievement patterns.
C. How Can Tracking Sales Metrics Improve Sales Performance?
When you measure sales metrics, you obtain helpful information about your sales processes, customer behavior, and market trends. Analyzing these data points can dramatically improve your sales KPIs results. Here’s how:
- Understanding what works best allows you to adjust your strategy. This improves sales efficiency and efficacy.
- Utilizing the sales KPIs to deliver customized coaching and training lets you focus on areas of improvement while maximizing your sales team’s strengths.
- Forecasting future income streams allows you to change your plans proactively, helping you stay ahead of the curve.
Conclusion
Following these 13 key sales performance metrics in 2026 can help you gain valuable insights to improve your sales channels and achieve long-term success.
This data empowers data-driven decisions, identifies improvement areas, and ultimately drives more sales.
What you can do with sales performance metrics becomes more impactful with an AI-powered conversation intelligence platform like Enthu.AI.
It goes beyond traditional call monitoring by providing deeper insights into performance and sales coaching opportunities.
FAQs
1. how to measure sales performance metrics?
To measure sales performance, focus on conversion rates to see what resonates and sales speed to keep momentum. Balance your team’s daily energy with customer loyalty to ensure growth feels sustainable and human.
2. How frequently should sales metrics be reviewed?
Regular assessments, such as monthly or quarterly, are essential for making timely changes to sales strategy. Sales targets should be updated to reflect current performance patterns.
3. What technologies can help you track sales data effectively?
Sales discussions are monitored using tools such as conversation intelligence systems. CRM systems and sales analytics software also provide powerful tools for effortlessly examining sales information.
4. What is sales performance metric?
Sales performance management (SPM) optimizes and tracks sales team performance by setting targets, monitoring progress, and providing tools to help salespeople achieve their goals and quotas.
5. how to track sales performance?
Start with the basics: conversion rate, deal size, pipeline velocity, and win rate. Then add call analytics and rep activity data from your CRM or AI tools. The goal: spot what’s working, who’s closing, and where leads drop off.
6. What metrics help evaluate AI performance in sales?
Look at lead scoring accuracy, meeting booking rate, response time, and revenue influenced by AI. Also track AI call summaries’ accuracy and recommendation-to-conversion ratio. If AI isn’t saving time or improving close rates, it’s not performing.