TL;DR
Customer dissatisfaction analysis helps you understand why customers are unhappy with your service. You analyze DSAT scores, identify patterns, and fix root causes. This guide covers everything from calculating DSAT metrics to implementing improvements. You’ll learn practical techniques to turn negative experiences into growth opportunities. We’ll show you how AI-powered tools can automate the entire process.
A. What is customer dissatisfaction analysis?
Customer dissatisfaction analysis is the systematic process of identifying, measuring, and understanding negative customer experiences. You examine why customers are unhappy and what triggers their frustration. This analysis goes beyond simply tracking scores, it uncovers the root causes behind poor experiences.
Think of it as detective work for your contact center. You’re investigating what went wrong and why it happened. The goal is to prevent similar issues from recurring.
Here’s what you’ll gain from this guide. You’ll learn how to measure dissatisfaction accurately. You’ll discover proven frameworks for root cause analysis.
You’ll understand how to implement changes that actually improve scores. Most importantly, you’ll see how AI-powered contact center intelligence can automate these insights in real-time.
B. Understanding DSAT score: the foundation of dissatisfaction analysis
DSAT stands for customer dissatisfaction score. It’s the reciprocal metric of customer satisfaction (CSAT).
While CSAT measures happy customers, DSAT focuses specifically on unhappy ones. You calculate it by measuring responses from customers who rate their experience poorly.
How to Calculate Your DSAT Score
The calculation is straightforward. You survey customers after interactions and ask: “On a scale of 1-5, how satisfied are you with the support you received today?”
Any response of 1 or 2 falls into the DSAT category. These represent your dissatisfied customers.
Here’s the formula:
DSAT Score = (Number of Dissatisfied Customers ÷ Total Customers Surveyed) × 100
For example, if you surveyed 100 customers and 20 reported dissatisfaction, your DSAT score is 20%.
| Metric | What It Measures | Calculation Method | Ideal Benchmark |
| DSAT | Customer dissatisfaction | (Dissatisfied responses ÷ Total responses) × 100 | Below 10% |
| CSAT | Customer satisfaction | (Satisfied responses ÷ Total responses) × 100 | Above 80% |
| NPS | Customer loyalty | % Promoters – % Detractors | Above 50 |
| CES | Effort required | Average of effort ratings (1-7 scale) | Below 3 |
You should track DSAT alongside other metrics like CSAT and NPS. This gives you a complete picture of customer sentiment.
C. Why DSAT matters more than you think
Your least happy customers provide your most valuable data. They show you exactly where your operation is failing.
Companies often ignore DSAT data because it’s uncomfortable. They focus only on positive CSAT scores and miss critical insights.
But here’s the reality: 70% of customers abandon a brand after just two bad experiences. You can’t afford to overlook dissatisfaction signals.
DSAT analysis helps you identify three critical problem areas. First, issues with customer support quality and agent performance. Second, problems with your product or service. Third, frustrations with company policies.
D. The three categories of customer dissatisfaction
Not all dissatisfaction is created equal. You need to categorize complaints to address them effectively.
1. Dissatisfaction with customer support
This category includes complaints about agent behavior and support quality. Customers get frustrated with long hold times, multiple transfers, and unknowledgeable agents.
Common issues include:
- Agents lacking product knowledge
- Inefficient problem resolution
- Poor escalation procedures
- Long wait times
- Having to repeat information multiple times
According to recent data, 47% of customers cite poor customer service as a loyalty breaker. Your agents are your frontline; they make or break the experience.
2. Dissatisfaction with product or service
Sometimes customers are unhappy regardless of how well your agent performs. The product itself is the problem.
This includes:
- Product defects or bugs
- Missing features
- Performance issues
- Quality not matching expectations
Research shows that 54% of customers say lower product quality weakens their loyalty. Even exceptional service can’t compensate for a faulty product.
3. Dissatisfaction with company policies
Customers often get frustrated with rules beyond your support team’s control. Return policies, operating hours, and pricing structures fall here.
These complaints are valuable because they highlight systemic issues. You can’t fix them at the agent level; they require organizational changes.
E. The 5-Step framework for effective dissatisfaction analysis
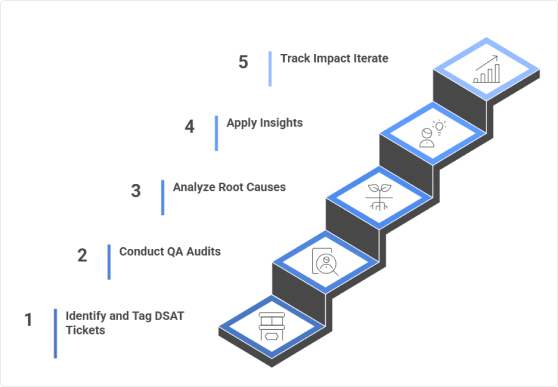
You need a systematic approach to turn DSAT data into actionable insights. Here’s a proven framework used by leading contact centers.
Step 1: Identify and tag DSAT tickets
Start by compiling all customer interactions with DSAT scores of 1 or 2. Tag them based on the three dissatisfaction categories we discussed.
Include a free-form text box in your surveys. This lets customers explain their low scores in their own words. These comments are gold for your analysis.
Modern AI-powered contact center platforms can automatically transcribe, summarize, and categorize these interactions. This saves your team hundreds of hours of manual work.
Step 2: Conduct quality assurance audits
QA audits add context to raw DSAT numbers. You review the actual agent-customer interaction to see what happened.
Use a QA scorecard based on your company’s standards. This scorecard should measure:
- Greeting and opening
- Active listening
- Problem-solving approach
- Product knowledge
- Empathy and tone
- Resolution effectiveness
- Closing and follow-up
DSAT data tells you customers are unhappy. QA audits tell you why.
You don’t need to audit every ticket if the volume is high. A representative sample works, but more data means more accurate insights.
Step 3: Perform root cause analysis
Root cause analysis uncovers the underlying issues driving dissatisfaction. Two proven techniques work especially well.
The 5 whys technique:
You ask “why” five times to drill down to the core problem. Here’s an example:
- Why was the customer dissatisfied? The agent couldn’t resolve their issue.
- Why couldn’t the agent resolve it? They lacked specific product knowledge.
- Why did they lack knowledge? That detail wasn’t covered in training.
- Why wasn’t it covered? The training program hasn’t been updated recently.
- Why hasn’t it been updated? No one owns the training update process.
The fishbone diagram:
This visual tool maps out potential causes across different categories. You place the problem at the “head” and branch out possible causes.
For example, if customers complain about long hold times:
- Staffing issues: Not enough agents during peak hours
- Process issues: Inefficient call routing
- Technology issues: Outdated phone system
- Training issues: Agents taking too long per call
Step 4: Apply insights to improve experiences
Analysis without action is worthless. You need to implement changes based on your findings.
Here are four high-impact areas to focus on:
- Improve agent onboarding: Update your training program with real examples from DSAT tickets. New agents should learn from past mistakes before encountering them.
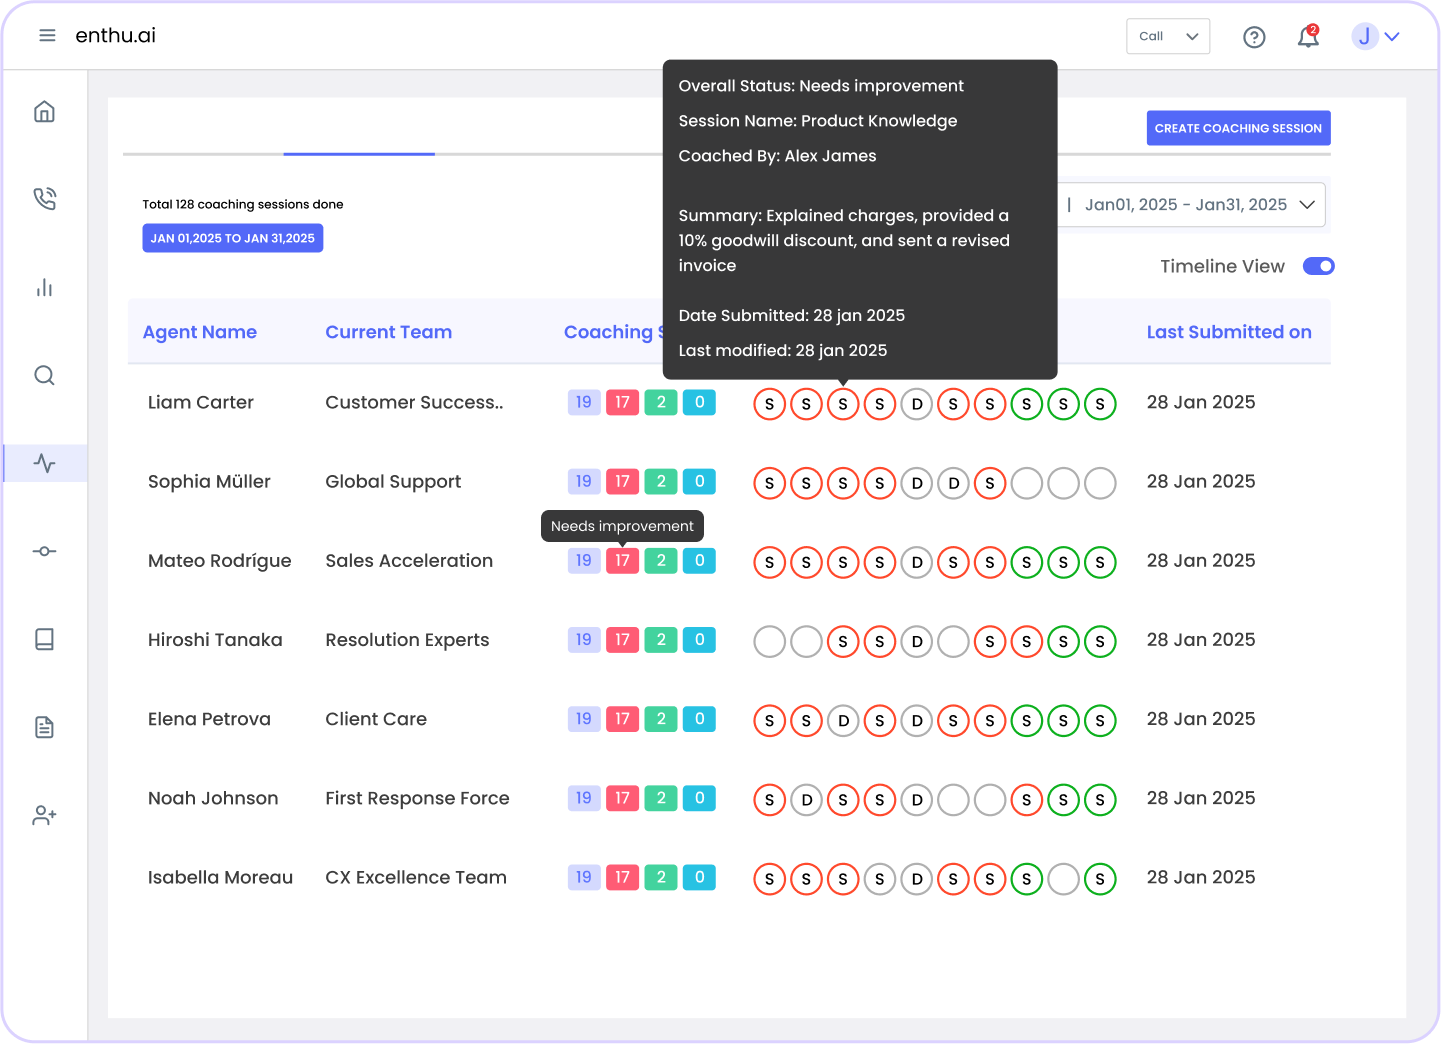
- Enhance coaching sessions: Use specific DSAT examples in one-on-one coaching. If agents are asking for information already in your CRM, train them on better data access.
- Expand your knowledge base: Document solutions to common DSAT issues. Make this information easily accessible to all agents.
- Recommend systemic changes: If dissatisfaction stems from policies or product issues, escalate to leadership. Your support team is on the frontlines – their insights matter.
Step 5: Track impact and iterate
You must measure whether your changes actually work. Track your DSAT scores monthly and watch for trends.
Use platforms that correlate DSAT scores with QA scores. This shows you the full picture of agent performance and customer satisfaction.
If scores don’t improve, dig deeper. Maybe you addressed symptoms but not root causes. Keep iterating until you see results.
F. Advanced techniques for dissatisfaction analysis
Basic DSAT tracking is just the beginning. Advanced techniques reveal deeper insights you might otherwise miss.
1. Sentiment analysis and speech analytics
Modern AI tools can analyze every customer conversation at scale. They detect emotional cues, frustration levels, and satisfaction indicators in real-time.
Speech analytics identifies patterns across thousands of calls. You discover common phrases, topics, and emotions linked to dissatisfaction.
Enthu.AI‘s sentiment analysis automatically transcribes and analyzes 100% of your conversations. It scores calls based on empathy, compliance, and script adherence – all factors that impact DSAT.
2. Correlation analysis
Don’t just look at DSAT in isolation. Correlate it with other metrics to find hidden relationships.
For example:
- Do longer average handle times correlate with higher DSAT?
- Does time of day affect dissatisfaction rates?
- Are certain agent teams seeing higher DSAT than others?
- Do first call resolution rates impact DSAT scores?
These correlations help you prioritize improvements with the biggest impact.
3. Predictive analytics
The most advanced approach is predicting dissatisfaction before it happens. AI models analyze interaction patterns and flag at-risk conversations in real-time.
This enables your agents to course-correct mid-conversation. They can escalate proactively or adjust their approach before the customer becomes dissatisfied.
G. Common causes of customer dissatisfaction
Understanding common causes helps you prevent problems before they start. Research shows several recurring patterns.
1. Poor customer service quality
This remains the number one driver of dissatisfaction. Customers expect knowledgeable, efficient, and empathetic support.
Specific issues include:
- Under-trained agents who can’t answer questions
- Long wait times that test patience
- Transfers that force customers to repeat information
- Agents reading from scripts without personalizing responses
Remember that 78% of customer service reps agree expectations are higher than ever. You need to raise your game continuously.
2. Incomplete customer data
70% of customers expect agents to have full context of their situation. When your systems don’t provide this, frustration builds fast.
Siloed data across departments creates problems. An agent can’t see what sales promised or what marketing sent. The customer has to explain everything again.
Integrated systems solve this problem. When all customer data lives in one place, agents can deliver seamless experiences.
3. Lack of self-service options
40% of support agents say customers get angry when they can’t resolve issues independently. Your knowledge base and FAQ resources must be comprehensive and easy to find.
Customers want to solve simple problems themselves. When self-service fails, they arrive at your contact center already frustrated.
4. Unmet expectations
Customers form expectations based on your marketing, previous experiences, and competitor offerings. When reality falls short, dissatisfaction follows.
This includes:
- Delivery times that don’t match promises
- Product quality below advertised standards
- Features missing from what was described
- Support availability that doesn’t meet stated hours
Set realistic expectations upfront. Transparency prevents disappointment better than over-promising ever could.
H. How AI transforms dissatisfaction analysis?
Manual DSAT analysis is time-consuming and prone to sampling bias. You can only review a fraction of interactions, missing valuable patterns.
Artificial intelligence changes everything. Modern platforms analyze 100% of your customer conversations automatically.
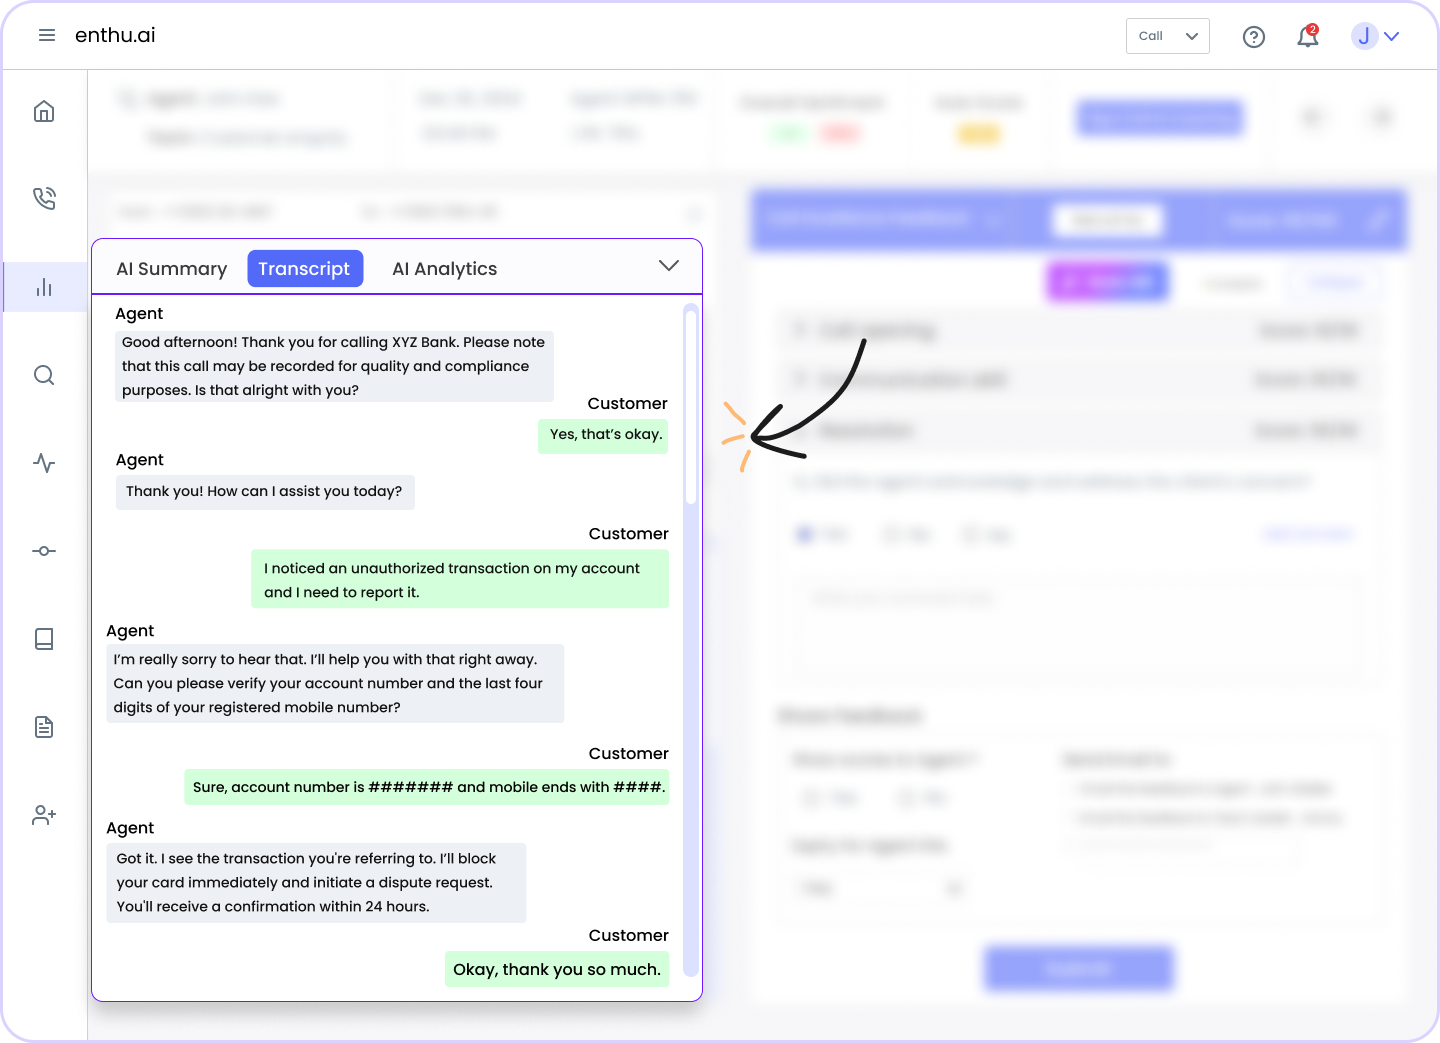
1. Automated transcription and summarization
AI transcribes every call with speaker labels and timestamps. It then generates summaries highlighting key points and next steps.
This makes it easy to review DSAT interactions without listening to entire recordings. You get the context you need in seconds, not minutes.
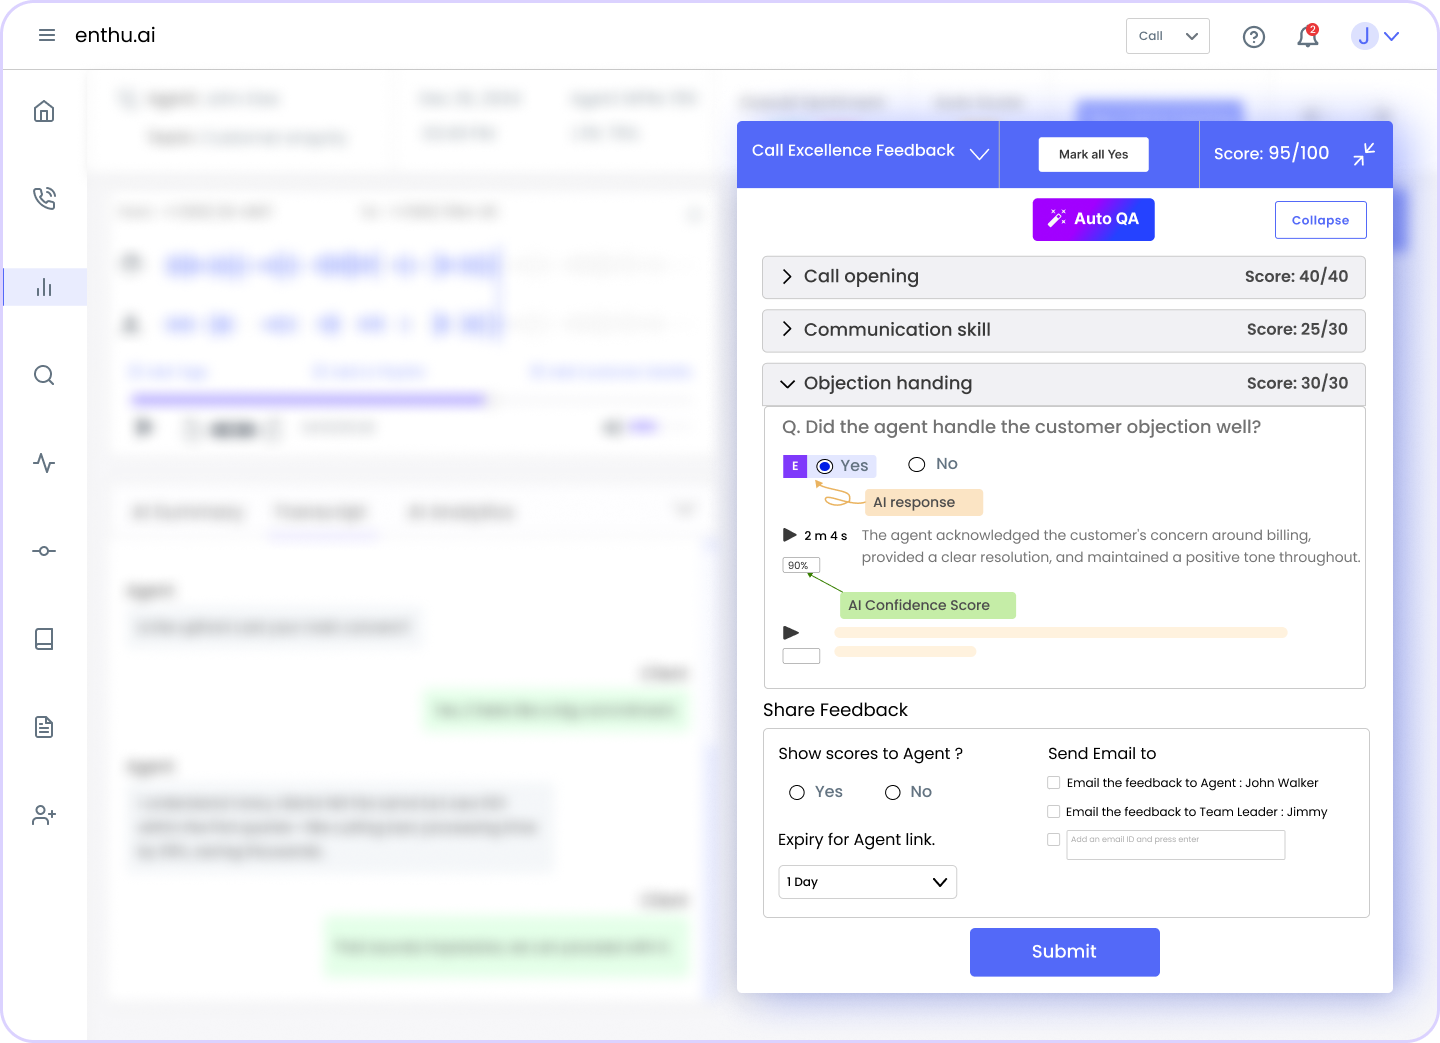
2. Intelligent auto-scoring
AI scores calls across multiple parameters like empathy, compliance, and script adherence. These scores correlate directly with customer satisfaction.
Enthu.AI‘s automated QA identifies improvement areas automatically. You see exactly where each agent needs coaching and why customers are dissatisfied.
3. Real-time assistance
The most advanced systems provide real-time guidance to agents during calls. If AI detects rising frustration, it can suggest proven de-escalation techniques.
This prevents dissatisfaction in the moment rather than analyzing it after the fact. You turn potential DSAT interactions into positive experiences before the customer hangs up.
4. Actionable insights at scale
AI processes thousands of interactions and surfaces trends you’d never spot manually. It identifies:
- Common complaint themes across your operation
- Specific product issues mentioned repeatedly
- Policy concerns that frustrate multiple customers
- Training gaps affecting multiple agents
These insights let you make data-driven decisions about where to invest in improvements. You’re not guessing, you’re acting on comprehensive evidence.
I. Best practices for reducing customer dissatisfaction
Analysis means nothing without implementation. Here are proven strategies to reduce DSAT scores and improve experiences.
1. Build a customer-first culture
Put customers at the center of every decision. When launching new features or changing policies, ask: “How will this impact customer satisfaction?”
Empower frontline agents to make decisions that benefit customers. Give them authority to waive fees, offer refunds, or escalate issues when needed.
2. Set clear, realistic expectations
Under-promise and over-deliver. Transparency about limitations prevents the disappointment that drives dissatisfaction.
Be specific about:
- Response times for different channels
- Resolution timeframes for various issue types
- Product capabilities and limitations
- Policy constraints that affect customer options
3. Continuously collect and act on feedback
Don’t wait for annual surveys. Collect feedback after every interaction and review it regularly.
Close the feedback loop by telling customers what you changed based on their input. This shows you value their opinions and take dissatisfaction seriously.
4. Invest in agent development
Your agents need ongoing training, not just initial onboarding. Update training based on real DSAT examples and emerging issues.
Regular coaching sessions focused on specific skills improve performance. Use actual call recordings to illustrate both good and bad examples.
5. Monitor metrics consistently
Track DSAT alongside metrics like CSAT, NPS, and First Call Resolution weekly or monthly. Look for trends and correlations between metrics.
Set up alerts for sudden spikes in dissatisfaction. Investigate immediately when scores change significantly.
Conclusion
Most companies view dissatisfied customers as problems to minimize. Smart companies see them as opportunities to improve.
Your DSAT tickets show you exactly where competitors might be failing too. Fix these issues and you differentiate yourself in the market.
Remember that customers who complain give you a second chance. They’re engaged enough to provide feedback. Silent customers just leave.
Respond quickly and effectively to dissatisfaction. Research shows that resolving complaints well can increase loyalty even beyond customers who never had problems.
Use AI-powered platforms like Enthu.AI to scale your dissatisfaction analysis. You can’t manually review thousands of interactions, but AI can analyze every single one.
The companies winning in 2025 don’t just track DSAT, they prevent it proactively with real-time intelligence and automated insights.
FAQs
1. What is the difference between DSAT and CSAT?
CSAT measures customer satisfaction by tracking positive responses, while DSAT specifically measures dissatisfaction by tracking negative responses (ratings of 1-2 on a 5-point scale). They’re inverse metrics that together provide a complete satisfaction picture.
2. How do you calculate a DSAT score?
Divide the number of dissatisfied customers by the total customers surveyed, then multiply by 100. For example, 20 dissatisfied customers out of 100 surveyed equals a 20% DSAT score. You can also calculate it as 100 minus your CSAT percentage.
3. What is a good DSAT score for contact centers?
A DSAT score below 10% is considered good for most contact centers. Anything above 20% indicates serious issues requiring immediate attention. Industry benchmarks vary, but lower is always better since it represents fewer dissatisfied customers.

 On this page
