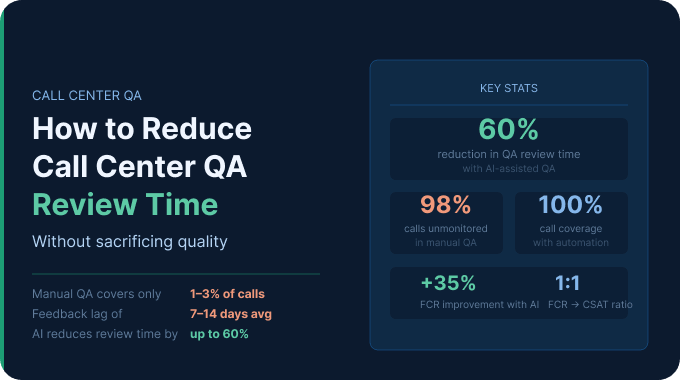
Call center quality assurance metrics are key performance indicators that measure agent effectiveness, customer satisfaction, and operational efficiency in contact centers. Tracking these metrics helps you improve customer experience, reduce operational costs, ensure compliance, and gain a competitive advantage.
Here’s a complete list of the most important call center QA metrics that drive customer satisfaction, agent performance, and business success.
| Metrics | What It Measures | Category | Industry Benchmark |
| First Call Resolution (FCR) | Issues resolved on first contact | Agent Performance | 70-80% |
| Average Handle Time (AHT) | Average call duration | Agent Performance | 4-8 minutes |
| Average Speed of Answer (ASA) | How quickly calls are answered | Agent Performance | <30 seconds |
| Agent Occupancy Rate | Time spent handling calls vs. idle | Agent Performance | 75-85% |
| Agent Turnover Rate | Percentage of agents leaving annually | Agent Performance | 30-45% |
| Compliance Score | Adherence to legal requirements | Compliance | 95-100% |
| Schedule Adherence | Following assigned schedules | Compliance | 90-95% |
| Script Compliance | Following the required scripts | Compliance | Varies |
| Customer Satisfaction Score (CSAT) | Customer satisfaction level | Customer Experience | 80-85% |
| Net Promoter Score (NPS) | Customer loyalty and likelihood to recommend | Customer Experience | 50+ |
| Customer Effort Score (CES) | Ease of issue resolution | Customer Experience | Low effort preferred |
| Quality Score | Overall agent performance rating | Customer Experience | 80-90% |
| Call Abandonment Rate | Callers who hang up before reaching an agent | Customer Experience | 5-8% |
What are call center QA metrics?
Call center quality assurance metrics are data points that measure how well your agents handle customer interactions. These metrics evaluate agent performance, compliance adherence, and customer satisfaction levels.
You need QA metrics to identify coaching opportunities, reduce operational costs, and ensure consistent service quality.
Why do quality assurance metrics matter?
Quality assurance metrics are essential for delivering exceptional customer service and maintaining operational excellence. Understanding why these call center metrics matter helps you prioritize the right measurements for your business goals.
1. Improved customer satisfaction
Quality metrics help you deliver better customer experiences. When you track CSAT and NPS consistently, you can spot issues before they escalate into negative reviews.
According to PwC, “In the U.S., 32% of customers will stop doing business with a brand they love after just one bad experience, while 59% will leave after several negative interactions”. QA metrics give you early warning signals to prevent churn.
2. Reduced operational costs
The right metrics help you optimize resources and cut unnecessary expenses. When you improve first call resolution by just 5%, you can save thousands of dollars monthly in repeat call costs.
Traditional QA teams can only review less than 1% of agent interactions, 3 to 5 calls per agent per month. AI-powered QA tools analyze 100% of customer interactions across all channels, according to CallMiner research. This means your QA team can focus on coaching instead of scorekeeping.
3. Compliance assurance
Compliance metrics protect your business from legal and regulatory risks. Industries like healthcare, finance, and insurance require strict adherence to disclosure requirements.
HIPAA violations alone can cost organizations up to $1.5 million per year per violation category, while GDPR fines reach up to €20 million or 4% of global turnover, and in 2024, U.S. regulators issued over $4.3 billion in compliance-related fines across financial institutions alone.
Tracking compliance scores ensures your agents follow required protocols on every call.
4. Competitive advantage
Companies that excel at QA metrics outperform competitors by 20-30% in customer retention. When you consistently deliver quality interactions, you build customer loyalty that drives long-term revenue growth.

13 essential call center QA metrics to track
Let’s explore each metric in detail with actionable formulas, industry benchmarks, and practical improvement strategies. Understanding how to measure and optimize these metrics gives you the foundation for a high-performing call center.
Agent performance & efficiency metrics
These metrics measure how effectively your agents handle customer interactions.
1. First call resolution (FCR)
FCR measures the percentage of customer issues resolved during the first contact. This is one of the most critical metrics for customer satisfaction and cost control.
Formula: FCR = (Total Calls Resolved on First Interaction ÷ Total Calls) × 100
Industry Benchmarks:
- E-commerce: 65-75%
- Healthcare: 75-85%
- Financial services: 70-80%
- Travel and hospitality: 70-80%
High FCR rates indicate your agents have the right training and resources. Low FCR typically signals knowledge gaps or process inefficiencies.
2. Average handle time (AHT)
AHT tracks the average duration of a complete customer interaction. This includes talk time, hold time, and after-call work.
Formula: AHT = (Total Talk Time + Total Hold Time + Total After-Call Work Time) ÷ Total Number of Calls
Industry Benchmarks:
- E-commerce: 4-6 minutes
- Healthcare: 6-8 minutes
- Financial services: 5-7 minutes
- Tech support: 10-15 minutes
You want to balance AHT with quality. Rushing calls to lower AHT can hurt customer satisfaction and increase repeat contacts.
3. Average speed of answer (ASA)
ASA measures how quickly your agents answer incoming calls. Long wait times frustrate customers and increase call abandonment rates.
Formula: ASA = Total Wait Time of All Answered Calls ÷ Total Number of Calls Answered
Benchmark: Most call centers aim for 90% of calls answered within 30 seconds.
Monitoring ASA helps you optimize staffing levels during peak hours. When ASA increases consistently, you may need more agents or better scheduling.
4. Agent occupancy rate
This metric shows the percentage of time agents spend handling calls versus idle time. It helps you understand workforce utilization.
Formula: Agent Occupancy Rate = (Total Call Handling Time ÷ Total Logged-In Time) × 100
Optimal Range: 75-85% occupancy
Too high occupancy leads to agent burnout. Too low indicates underutilization and inefficiency.
5. Agent turnover rate
Agent turnover measures how many agents leave your organization annually. High turnover increases training costs and disrupts service quality.
Industry Average: Call centers experience 30-45% annual turnover rates.
Tracking this metric alongside satisfaction surveys helps you identify retention issues early. When turnover spikes, investigate workplace culture and compensation factors.
Compliance & adherence metrics
These metrics ensure your agents follow required protocols and regulations.
6. Compliance score
The compliance score evaluates how well agents adhere to legal requirements and company policies. This includes mandatory disclosures, verification steps, and regulatory guidelines.
Benchmark: Target 95-100% compliance on critical actions.
Non-compliance in regulated industries can trigger audits and penalties. Use AI-powered conversation intelligence to flag compliance risks automatically.
7. Schedule adherence
Schedule adherence tracks whether agents start and end shifts on time and take breaks as scheduled. Poor adherence disrupts service levels and increases wait times.
Formula: Schedule Adherence = (Time in Adherence ÷ Total Scheduled Time) × 100
Target: 90-95% adherence
Consistent monitoring helps you identify agents who need coaching on time management.
8. Script compliance
Script compliance measures whether agents follow required scripts or talking points. This is especially important for sales calls and regulated disclosures.
Balancing script compliance with natural conversation is key. Agents who sound robotic receive lower satisfaction scores despite following scripts perfectly.
Customer experience & satisfaction metrics
These metrics measure how customers perceive their interactions with your team.
9. Customer satisfaction score (CSAT)
CSAT measures how satisfied customers are with a specific interaction. You typically collect this through post-call surveys.
Formula: CSAT = (Number of Satisfied Customers ÷ Total Survey Responses) × 100
Industry Benchmarks:
- E-commerce: 80-85%
- Healthcare: 78-85%
- Financial services: 78-82%
- Travel: 85-90%
Ask customers to rate their experience on a 1-5 or 1-10 scale. Scores of 4-5 (or 8-10) indicate satisfaction.
10. Net promoter score (NPS)
NPS measures customer loyalty by asking how likely they are to recommend your company. This predicts long-term business growth better than CSAT.
Formula: NPS = % of Promoters – % of Detractors
Score Ranges:
- Promoters: 9-10
- Passives: 7-8
- Detractors: 0-6
Benchmark: NPS above 50 is excellent; above 70 is world-class.
NPS correlates strongly with revenue growth and customer lifetime value. When your NPS declines, investigate what’s driving customer dissatisfaction.
11. Customer effort score (CES)
CES evaluates how easy it was for customers to get their issues resolved. Lower effort leads to higher loyalty.
Benchmark: Customers rate the effort required on a 1-7 scale. Scores of 1-2 indicate low effort (good), while 6-7 signal high effort (bad).
Customers with high-effort experiences become more disloyal. Focus on reducing customer effort through better processes and agent training.
12. Quality score
Quality score is an overall evaluation of agent performance based on your QA scorecard. This combines multiple metrics into a single assessment.
Benchmark: Target 80-90% quality scores.
Your scorecard should include communication skills, problem-solving, compliance, and customer handling. Regular calibration sessions ensure consistent scoring across evaluators.
13. Call abandonment rate
This metric tracks the percentage of callers who hang up before reaching an agent. High abandonment rates indicate long wait times or poor IVR experiences.
Formula: Call Abandonment Rate = (Abandoned Calls ÷ Total Incoming Calls) × 100
Benchmark: 5-8% or lower
When abandonment rates spike, check your ASA and staffing levels. Consider callback options to reduce customer frustration.
How to measure QA metrics effectively?
Measuring quality assurance metrics requires a systematic approach that combines technology, processes, and human judgment. Follow these five steps to build a robust QA measurement system.
Step 1: Identify your goals
Start by defining what you want to achieve. Are you focused on reducing costs, improving satisfaction, or ensuring compliance?
Different goals require different metric priorities. A healthcare call center should emphasize compliance, while an e-commerce center might prioritize FCR and CSAT.
Involve stakeholders from operations, training, and leadership. This alignment ensures everyone understands why specific metrics matter.
Step 2: Create scorecards & checklists
Build a standardized QA scorecard that reflects your priorities. Your scorecard should include 10-15 observable behaviors that agents can control.
Assign weights based on business impact. Compliance items should carry the highest weight, typically 30-40% of the total score.
Define clear scoring criteria for each metric. Vague definitions create inconsistent evaluations and agent frustration.
Step 3: Monitor & analyze calls
Traditional QA involves manually reviewing a sample of calls. Most teams evaluate 3-5 calls per agent monthly due to time constraints.
Modern conversation intelligence platforms analyze 100% of calls automatically. This eliminates sampling bias and surfaces issues faster.
AI-powered tools can detect sentiment, compliance risks, and coaching opportunities in real-time. This lets you intervene before small problems become systemic issues.
Related: See our comparison of the best call center quality monitoring tools for 2026.
Step 4: Collect customer feedback
Deploy post-call surveys to measure CSAT, NPS, and CES. Keep surveys short (2-3 questions) to improve response rates.
Link survey results to specific agents and interactions. This connection helps you understand which behaviors drive satisfaction.
Monitor feedback trends weekly rather than waiting for monthly reports. Quick action on declining scores prevents customer churn.
Step 5: Use QA software to scale
Manual QA processes can’t keep pace with high call volumes. Modern QA software provides automated scoring, trend analysis, and coaching recommendations.
Platforms like Enthu.ai use AI to evaluate every conversation for quality, compliance, and customer sentiment. This gives you complete visibility instead of relying on small samples.
Look for solutions that integrate with your existing call center technology. Seamless data flow improves accuracy and reduces manual work.
Best practices for implementing QA metrics
Implementing quality assurance metrics successfully requires more than just tracking numbers. These best practices help you turn data into actionable improvements that transform agent performance.
1. Set clear standards
Document exactly what “good” looks like for each metric. Create examples of excellent, acceptable, and poor interactions.
Share these standards with your entire team. When agents understand expectations, they perform better and accept feedback more readily.
Update standards annually to reflect changing customer expectations. What worked in 2024 may not meet 2026 customer demands.
2. Use AI-powered auto-scoring
AI eliminates evaluator bias and scores calls consistently. Large language models can assess empathy, clarity, compliance, and predict customer satisfaction with 95% accuracy.
Automated scoring also expands coverage from 2-3% of calls to 100%. This reveals patterns that small samples miss completely.
Reserve human evaluators for complex edge cases and calibration. This hybrid approach combines AI efficiency with human judgment.
3. Conduct regular calibration
Schedule monthly calibration sessions where evaluators score the same calls. Compare results to identify scoring inconsistencies.
When evaluators disagree, clarify scoring criteria and update your documentation. Consistent scoring builds trust in your QA program.
Track inter-rater reliability scores. Aim for 85-90% agreement across evaluators.
4. Deliver real-time coaching
Real-time coaching during calls helps agents correct mistakes immediately. AI tools can prompt agents when they forget required disclosures or miss opportunities.
Post-call coaching should happen within 48 hours. Delayed feedback loses impact and fails to change behavior.
Focus coaching on 2-3 specific behaviors rather than overwhelming agents with feedback. Targeted coaching drives faster improvement.
5. Link metrics to training
Use QA data to identify training gaps across your team. If 60% of agents struggle with objection handling, create targeted training modules.
Measure training effectiveness by tracking metric improvements. Quality training should produce measurable results within 30-60 days.
Create personalized learning paths based on individual QA scores. Agents need different development focus areas.
Common challenges in measuring QA metrics
Even well-designed QA programs encounter obstacles that limit their effectiveness. Understanding these challenges helps you proactively address them before they undermine your quality initiatives.
1. Limited evaluation coverage
Manual QA teams typically evaluate less than 5% of total calls. This small sample creates blind spots where issues hide undetected.
Agents may also game the system if they know which calls get reviewed. This produces artificially high scores that don’t reflect actual performance.
Solution: Deploy AI-powered conversation intelligence to analyze 100% of interactions. Complete coverage eliminates sampling bias and manipulation.
2. Evaluator bias
Human evaluators bring unconscious biases that affect scoring. Favorite agents may receive higher scores for identical performance.
Without regular calibration, scoring drift occurs over time. Each evaluator develops their own interpretation of scoring criteria.
Solution: Implement regular calibration sessions and use AI for objective scoring. Track inter-rater reliability to catch bias early.
3. Time-consuming manual reviews
Evaluating a single call can take 15-20 minutes. For a team of 50 agents, reviewing 5 calls each requires 62+ hours monthly.
This time burden prevents QA teams from providing timely feedback. By the time evaluations complete, the moment for effective coaching has passed.
Solution: Automate routine scoring with AI and reserve human effort for coaching conversations. This shifts QA from administrative work to high-value development.
4. QA KPI manipulation
When agents know which calls get evaluated, they perform differently. This creates a false picture of everyday performance.
Focusing solely on QA scores rather than customer outcomes drives wrong behaviors. Agents optimize for the scorecard instead of genuine customer satisfaction.
Solution: Combine QA metrics with customer feedback and operational data. Look for alignment between QA scores and actual CSAT results.
Track the right metrics to transform your call center
Call center quality assurance metrics give you the visibility needed to improve agent performance, boost customer satisfaction, and reduce operational costs.
Start by tracking the 13 essential metrics outlined in this guide. Focus on those that align with your business goals and industry requirements.
Modern QA programs leverage AI-powered conversation intelligence to analyze 100% of calls rather than small samples. This approach eliminates bias, surfaces issues faster, and enables proactive coaching.
This lets your team focus on coaching and development instead of manual evaluation tasks.
The contact centers that excel in 2026 treat QA metrics as strategic tools for continuous improvement, not just compliance checkboxes. When you measure the right metrics consistently and act on the insights, you create experiences that drive customer loyalty and business growth.
FAQs
1. What are industry benchmarks for call center QA metrics?
Industry benchmarks vary by sector. E-commerce centers target 65-75% FCR and 80-85% CSAT. Healthcare call centers aim for 75-85% FCR and 6-8 minute AHT. Financial services typically target 70-80% FCR and 78-82% CSAT.
2. How do I align QA metrics with business goals?
Start by identifying your primary business objectives. If reducing costs is the priority, focus on FCR and AHT. If customer retention matters most, emphasize CSAT, NPS, and CES. For compliance-heavy industries, weight regulatory adherence metrics highest. Engage stakeholders from operations, finance, and leadership to ensure alignment. Review metric priorities quarterly as business goals evolve.
3. Can QA metrics predict customer churn?
Yes, several QA metrics serve as early warning indicators. Low CSAT scores (below 3 out of 5) strongly correlate with churn risk. Declining NPS indicates weakening customer loyalty before actual cancellations occur. High Customer Effort Scores predict future churn, as 96% of high-effort customers become disloyal.


 On this page